AIM: Demonstrating the Superior OTR Capacity of the jFermi Bioreactor: High-Performance Yeast Cultivation on High Glucose Substrate.
Media Preparation: According to Balázs’s suggestion for validating the OTR capacity of the jFermi bioreactor, a Saccharomyces cerevisiae cultivation was performed in a yeast extract and peptone medium with glucose. To prepare the medium, 4 g of yeast extract and 8 g of bacteriological peptone were dissolved in 180 mL of distilled water. Separately, 8 g of sucrose was dissolved in 20 mL of distilled water. Then, 180 mL of the yeast extract and peptone solution was poured into the reactor, and 20 mL of the glucose solution was sterilized separately.
- Peptone, Bacteriological – HIMEDIA, RM001-100G, LOT0000341089
- Yeast Extract Powder – HIMEDIA, RM027-100G, LOT0000374946
- Szőlőcukor pasztilla – Újfehértó (Mentol ízű) 99.5 % glucose content
Bioreactor preparation: After calibration, the DO (dissolved oxygen) and pH electrodes were inserted into the bioreactor and placed in the autoclave, along with the glucose solution, feed, antifoam, and peristaltic pump tubing. The autoclaving process was performed at 121°C for 21 minutes. After autoclaving was finished, 20 mL of glucose solution and 200 µL of antifoam were added to the medium. The temperature was then set to 30°C, and the pH was adjusted to 5.5.
Inoculum preparation: 20 g of Uvaferm PM [cold (6°C) and alcohol (17 v/v%) tolerant] wine yeast was suspended in 200 mL of sterile warm water. After 15 minutes, 5 mL of the suspension was used to inoculate the bioreactor.
Antifoam: Foamsol water based defoamer (AB Vickers, Kokoferm Kft.)
After being diluted 2 times with water and sterilized, it formed lumps, making it difficult to aspirate into a 2 mL syringe through a needle.
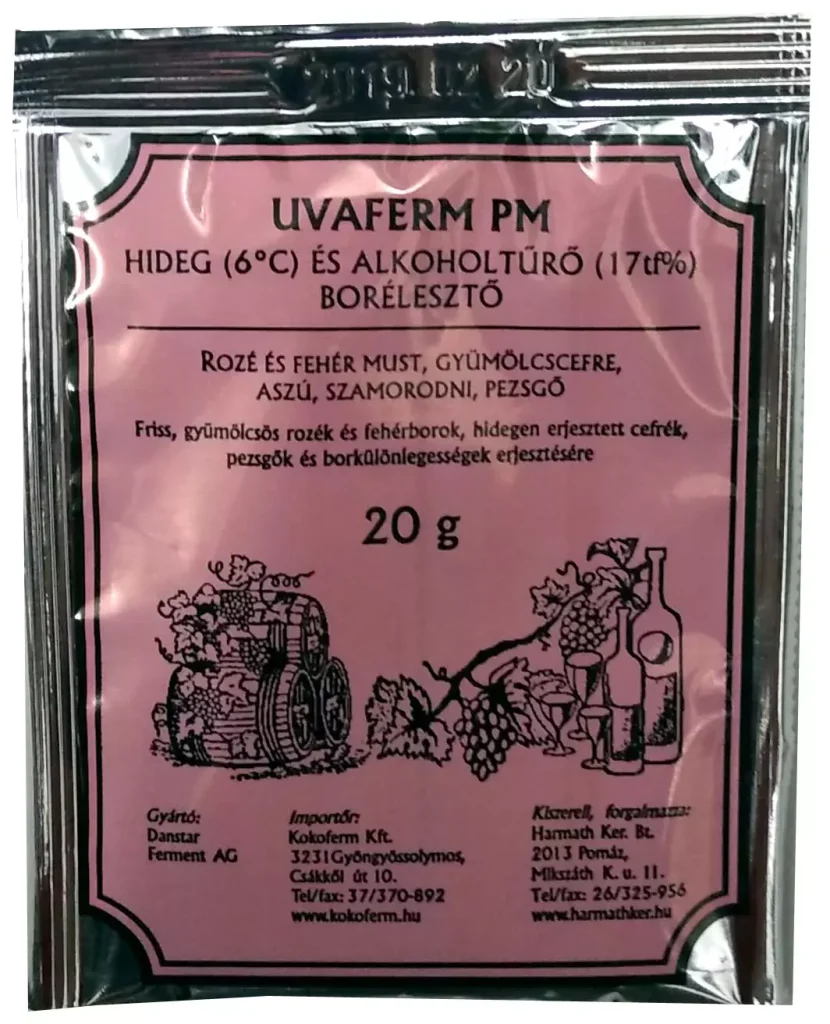 |
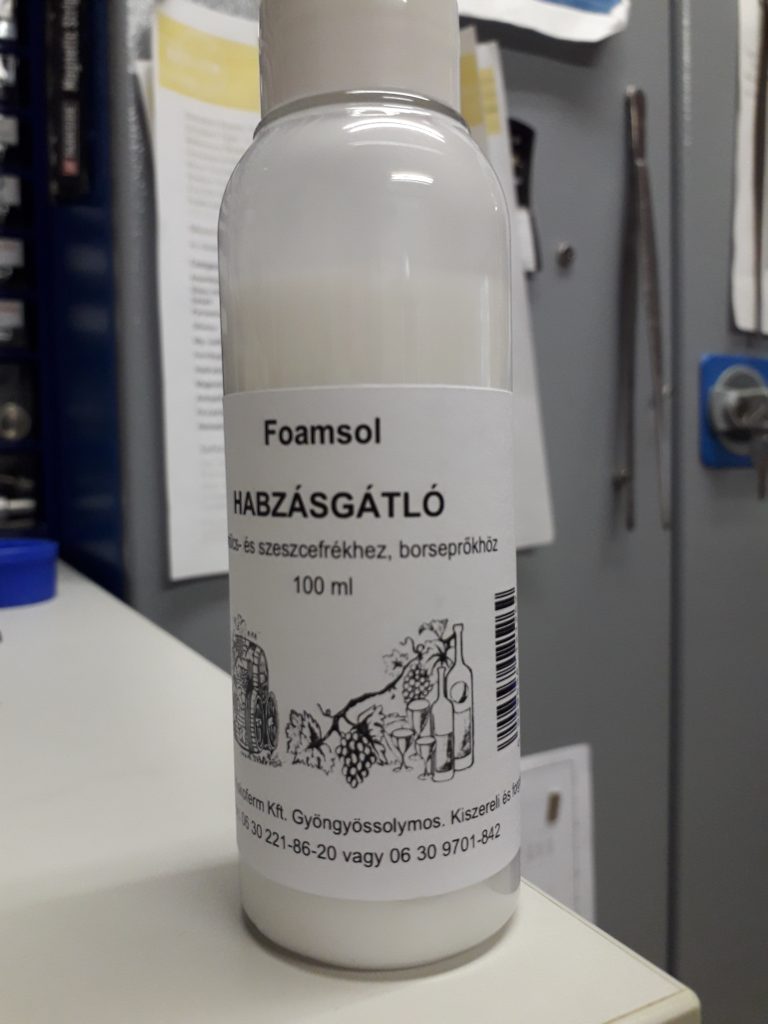 |
| Freeze dried yeast culture | Antifoam |
| Fermentation conditions | |||||||||
| Batch Number | GG20240908 | Date | 08/09/2024 | Operator | GG | Settings | |||
| Strain name | Saccharomyces cerevisiae | Medium | Peptone – Yeast Extract | |
Growth T | 30 | °C | ||
| Carbon source | Glucose | Acceptor | – | Production T | 30 | °C | |||
| Media Composition | Yeast extract: 20 g/L, Peptone, bacteriological: 40 g/L, Glucose: 40 g/L | pH | 5.5 | -log[H+] | |||||
| Plasmids | – | Airflow | 200 | mL/min | |||||
| Stirring | 300 | rpm | |||||||
| Aim | OTR Capacity test | ||||||||
| Process | YEPG-1 | Inoc. OD680 | 4.89 | Starting volume [mL] | 205 | DO | 20 | % | |
| Unit | MirrorBio | Inoc. Vol. | 5 mL | End volume [mL] | FED | 500 | g/L | ||
| Flow rate 1 | 1.07 | mL/h | |||||||
| Plate & Inoculums | Flow rate 2 | 1.33 | mL/h | ||||||
| Cell-bank | Streak date | Antibiotics | Medium | |
Addition | Silicon-based antifoam | 200 uL | ||
| Plate | – | – | – | – | |||||
| Inoculum | Inoc. date | Antibiotics | Medium | Vol | Harvest age (h) | Temp (°C) | End OD | ||
| Inoculum 1 | Uvaferm PM | 08/09/2024 | – | Water | Suspension | 0 | 32 | – | |
| Inoculum 2 | – | – | – | – | – | – | – | – | |
OD680 of 1 ≈ 0.4 to 0.5 g/L dry weight (DCW)
| Growth data & additions | |||||||||
| time (h) | Sample | OD (600 nm) | Dilution factor | OD | Doubling time [h] | FED bottle m [g] | Base bottle m [g] | Base added [g] | Comment |
| 0,00 | 1 | 0.815 | 6 | 4.89 | 295 | 0 | |||
| 16 | 2 | 0.576 | 30 | 17.28 | 8.79 | 293.6 | |||
| 23h46min | 3 | 0.449 | 60 | 26.94 | 422.3 | 293.4 | +100uL Afoam. Feed was sterted | ||
| 24h20min | feed was stopped | ||||||||
| 25h | feedind was started | ||||||||
| 27h34min | 413.8 | 292.8 | afoam was added 200uL | ||||||
| 40h45min | 4 | 0.397 | 100 | 39.7 | 372.2 | 291.6 | Feed was stopped | ||
| 42h | 200uL | ||||||||
| 45h53m | 5 | 0.411 | 100 | 41.1 | 372.2 | 291.5 | |||
| 48h47min | 6 | 0.466 | 100 | 46.6 | 372.1 | 291.5 | Ferm. was stopped | ||
Δt=26h46min
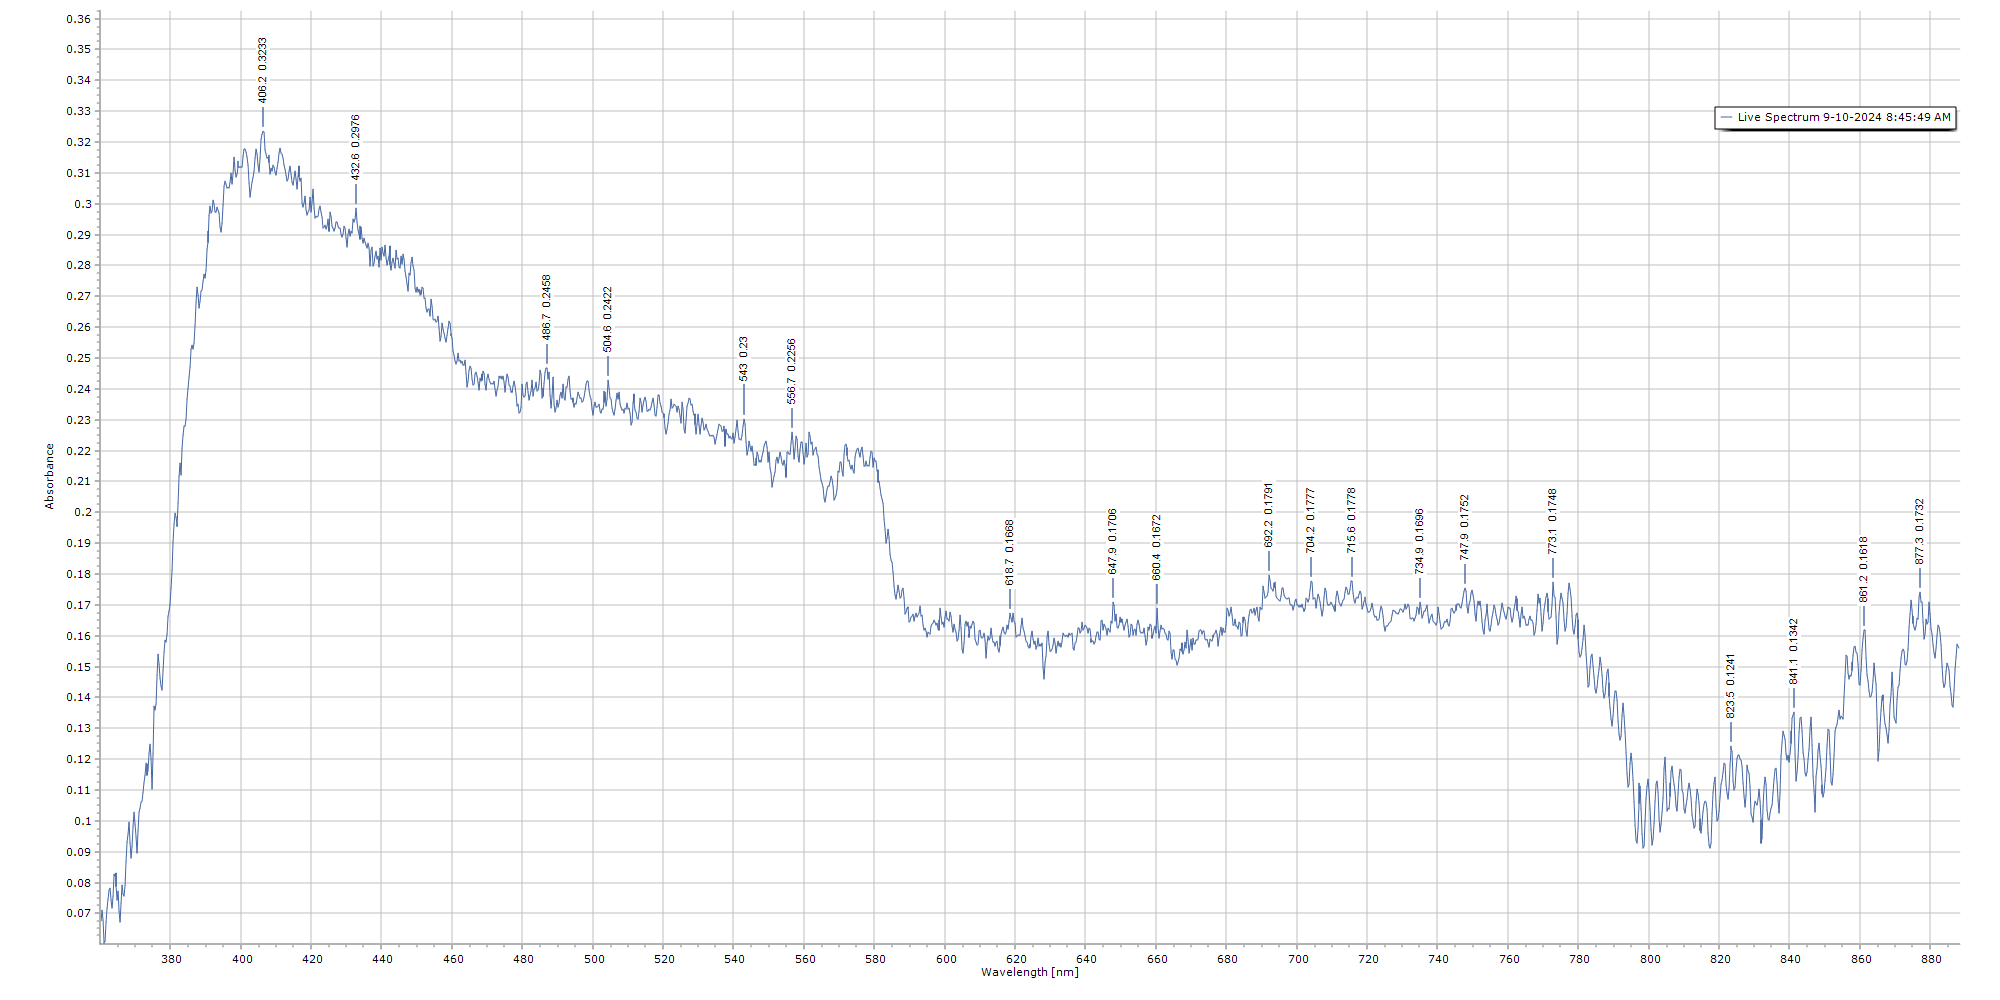
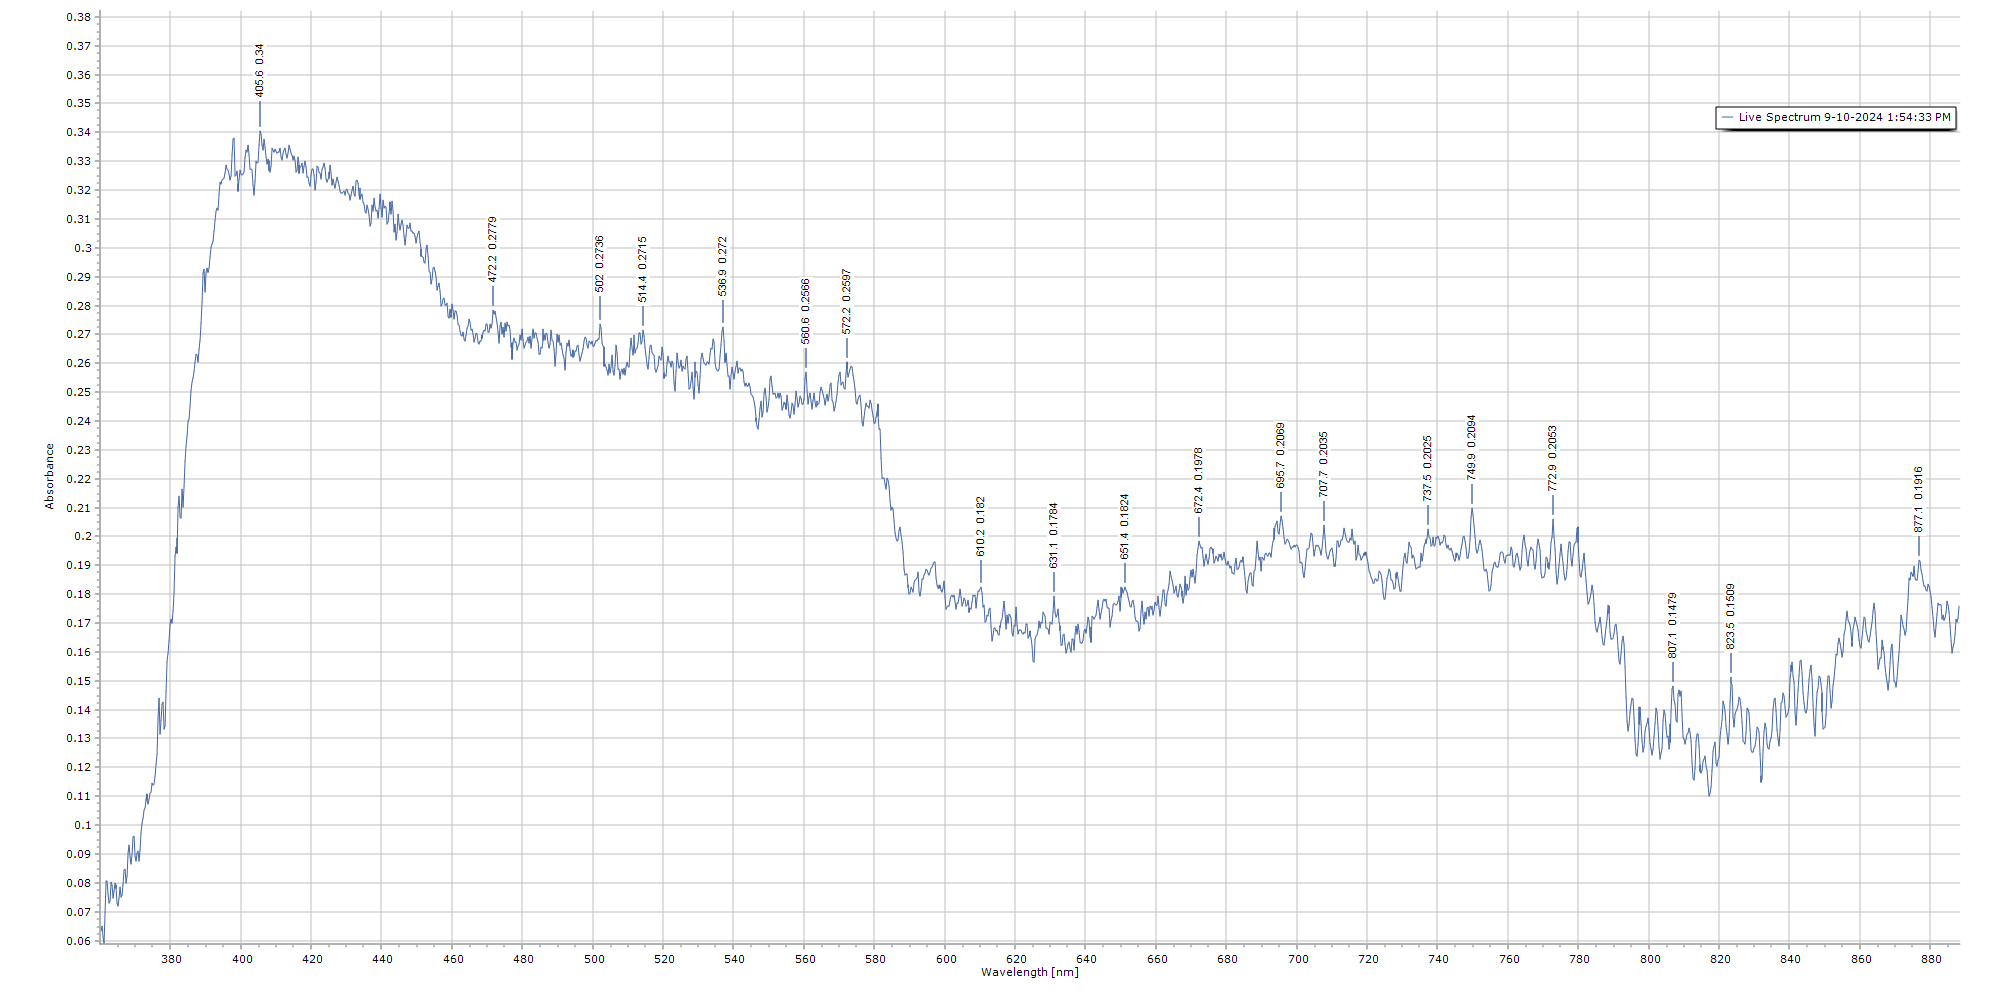
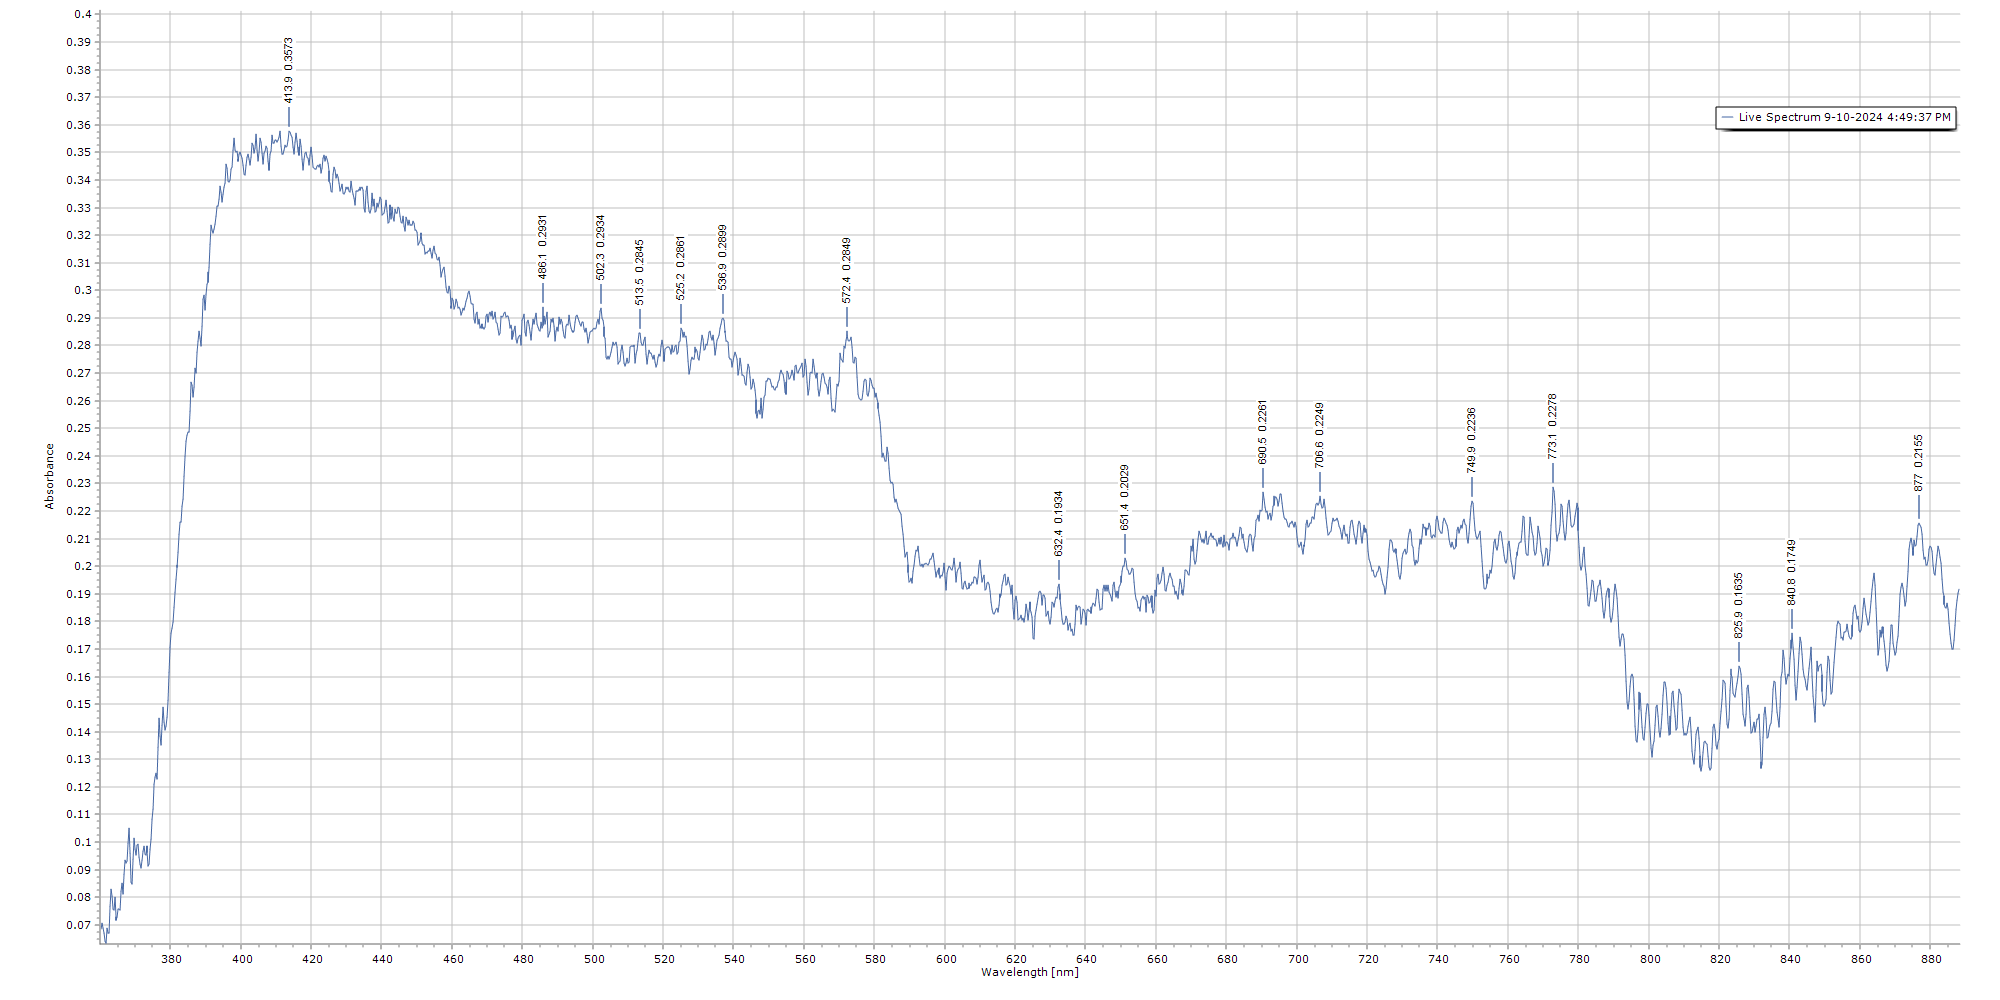
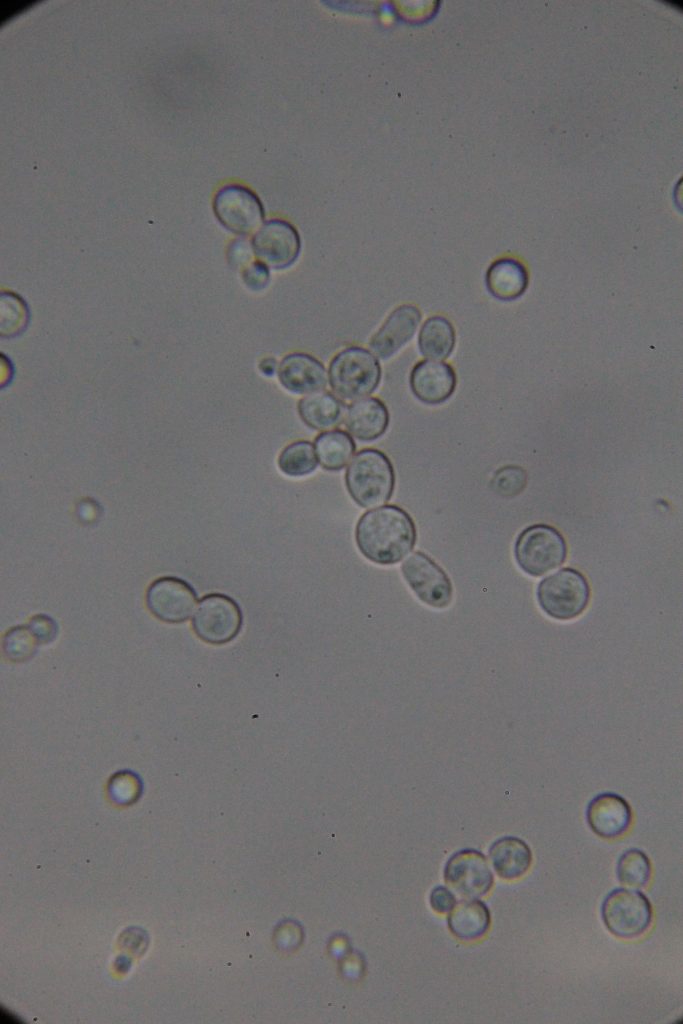
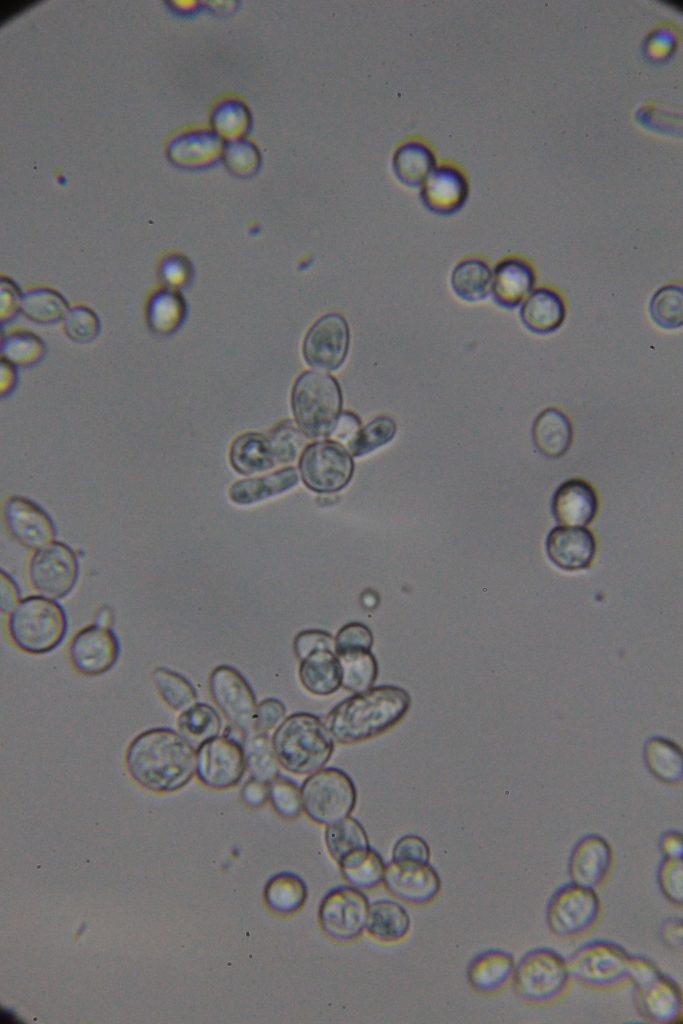
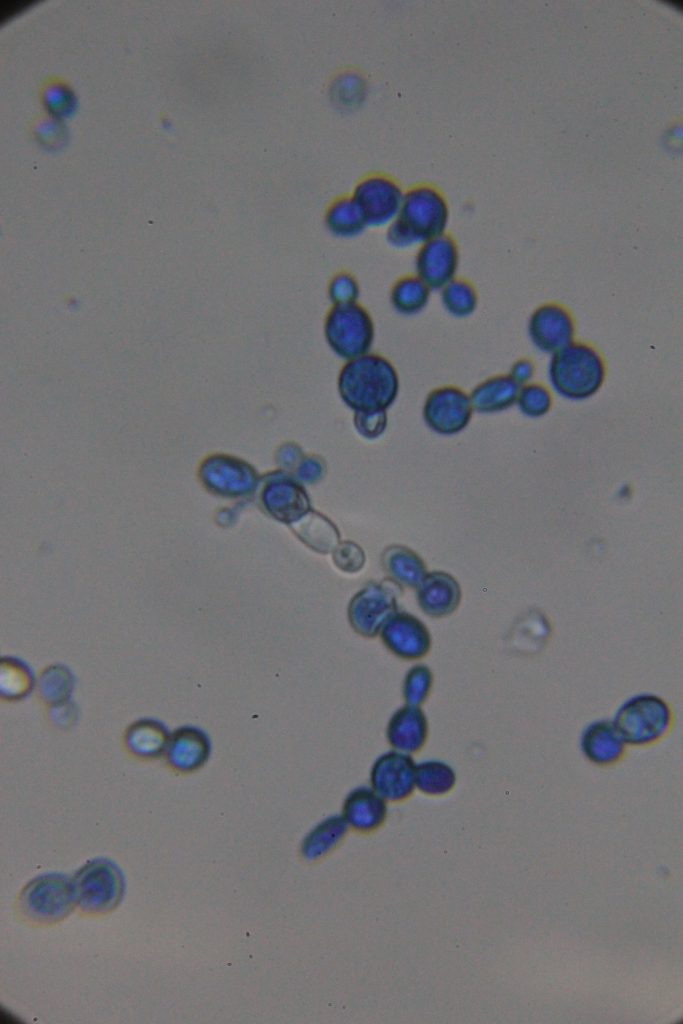
Methylene blue staining is a common technique used in microbiology and cell biology to visualize yeast cells under a microscope. Here’s a summary of what you need to know:
Purpose: Methylene blue is used as a vital stain to distinguish live cells from dead cells and to visualize cellular structures. Live cells typically exclude the dye and remain unstained, while dead or damaged cells take up the dye and appear blue.
 |
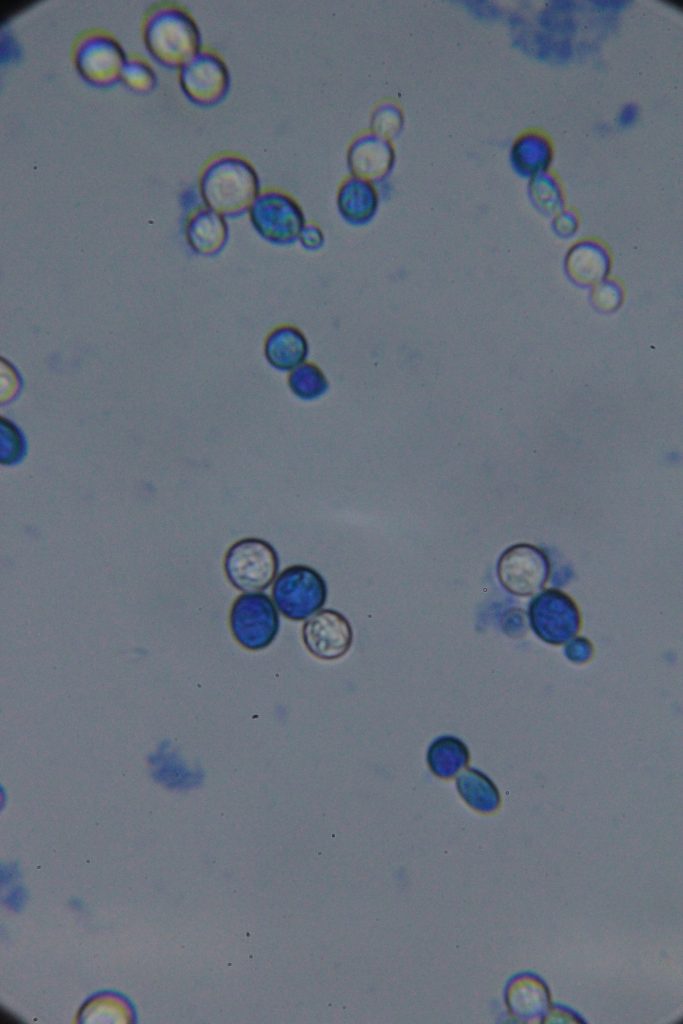 |
| Native | Stained with Methylene blue |
Δt=45h53min
 |
 |
| Native | Stained with Methylene blue |
According to the literature, methylene blue staining is not considered very reliable for quantitatively determining the percentage of dead cells. However, if you use the same dye concentration and cell concentration while adhering strictly to the staining time, you can observe a significant increase in the number of dead or metabolically inactive cells at 46h compared to at 26h.
Evaluation
DO-STR
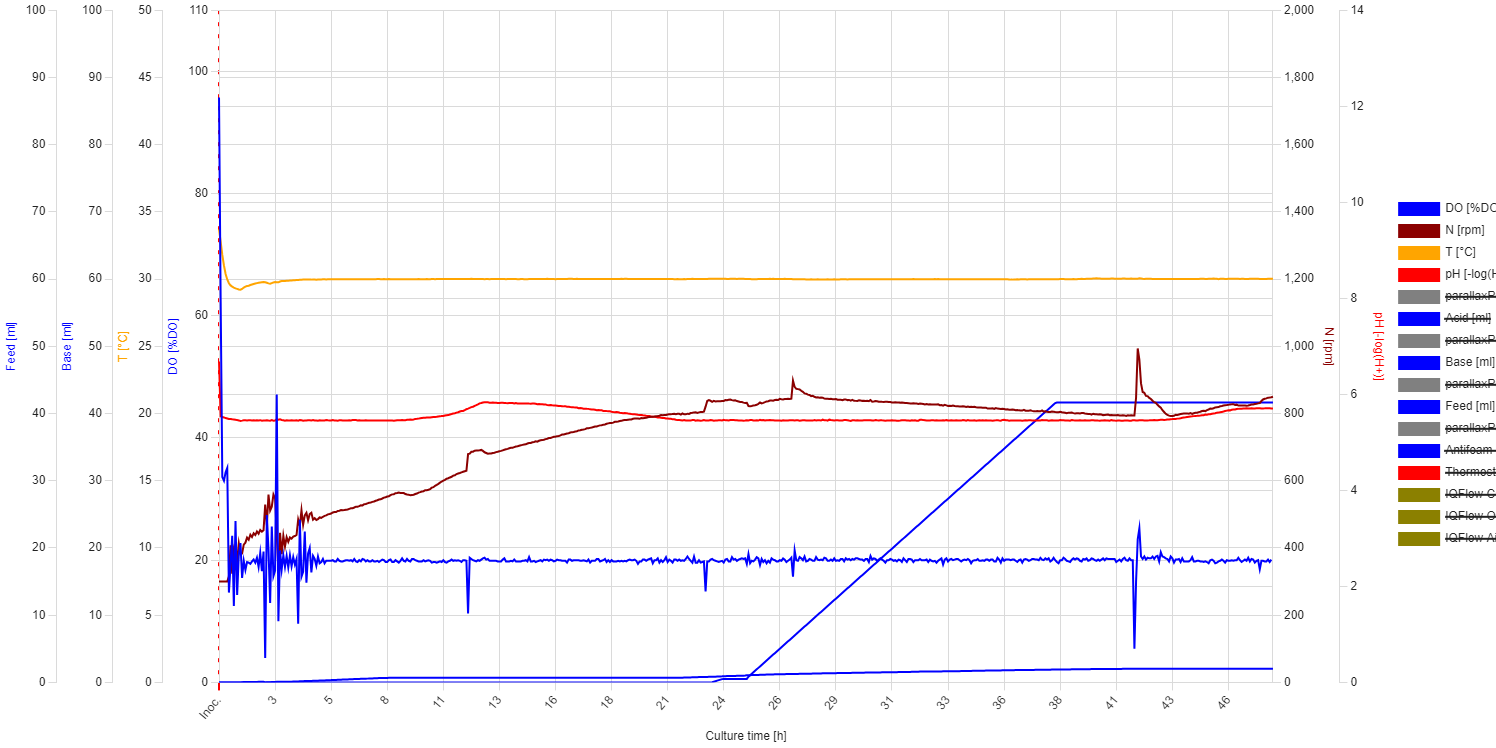
After inoculation, the DO level steeply decreased until 0.11 h, reaching 33%, then slightly increased to 35% by 0.36 h. From that point, it steeply decreased again, hitting the 20% threshold at 0.42 h, which triggered the PID control. At this stage, the stirring speed gradually increased from 300 rpm to 898 rpm, which was reached at 26.6 h. Afterward, the stirring speed slowly decreased, while the DO level was maintained at 20%.
pH – Base addition

The starting pH was set to 5.5 using 10% sulfuric acid, but during fermentation, only 10% sodium hydroxide was used to maintain the pH. On the jFermi plot, the total base addition was barely noticeable, and the pH change appeared negligible. However, upon closer examination of the zoomed plot, it’s evident that a significant change occurred. It’s unlikely this was due to complete glucose depletion, but rather the glucose concentration dropped below a critical level, triggering a metabolic shift. As is well known, Saccharomyces cerevisiae can synthesize all 20 amino acids required for protein production from basic nutrients like ammonium salts (as a nitrogen source) and a carbon source. In this setup, yeast uses its metabolic pathways to generate amino acids and grow. Therefore, next time, I will use 10-20 g/L peptone instead of 40 g/L, supplement with inorganic mineral nitrogen, and expect a more defined pH and oxygen peak at glucose depletion.
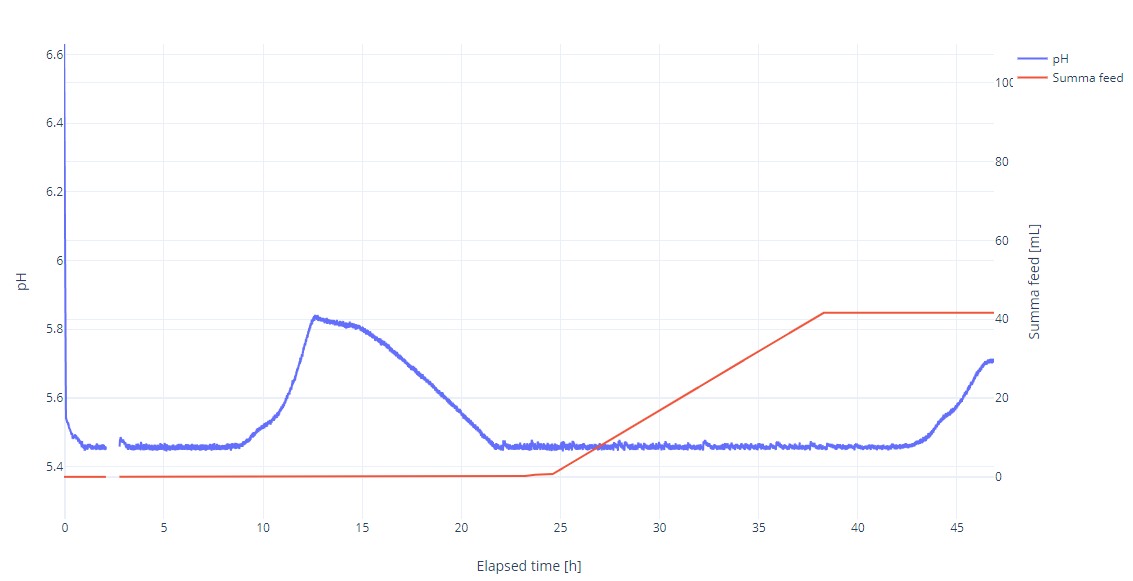
Feeding started at 25 h with a feed rate of 3 mL/h and was stopped at 40 h 45 min. Five hours after feeding stopped, the pH began to rise again, indicating that the glucose concentration had dropped below a certain critical level.
| Observations (fermentation behavior) |
General Conclusions | ||||
| Growth in inoculum | – | ||||
| OD and BWM | |||||
| Lenght of batch phase | |||||
| Yxs[g/g] | |||||
| Ysp[g/g] | |||||
| Aeration/pO2 | |||||
| Quality of broth | |||||
| Appearance of sample | |||||
| Other (foaming, pH…) | |||||
| Technical issue | |||||
| Human error | |||||
