Structure of the temperature control module
Heating and cooling unit
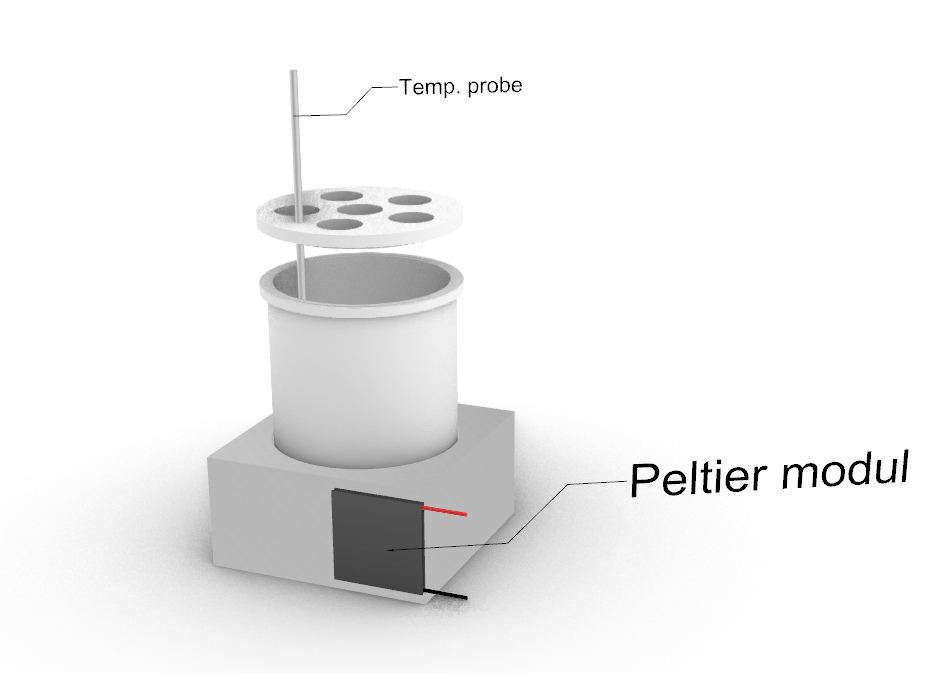
As shown in the figure on the left, the unit consists of two parts: a bored aluminum block holding the fermenter vessel, and a mounted Peltier element.
Aluminium block:
|
Peltier modul:
|
The heat generated on the other side of the Peltier element is removed by cooled water, which is transferred to the environment via an external, fan-cooled heat exchanger.
Controller and measurement hardware
The hardware consists of 3 main IC components: 2 BTN modules (1 full bridge driver), and 1 INA219 current meter, mounted on a Raspberry HAT. A PWM signal controls the BTN IC; the INA219 communicates with the Raspberry over a n I2C bus.
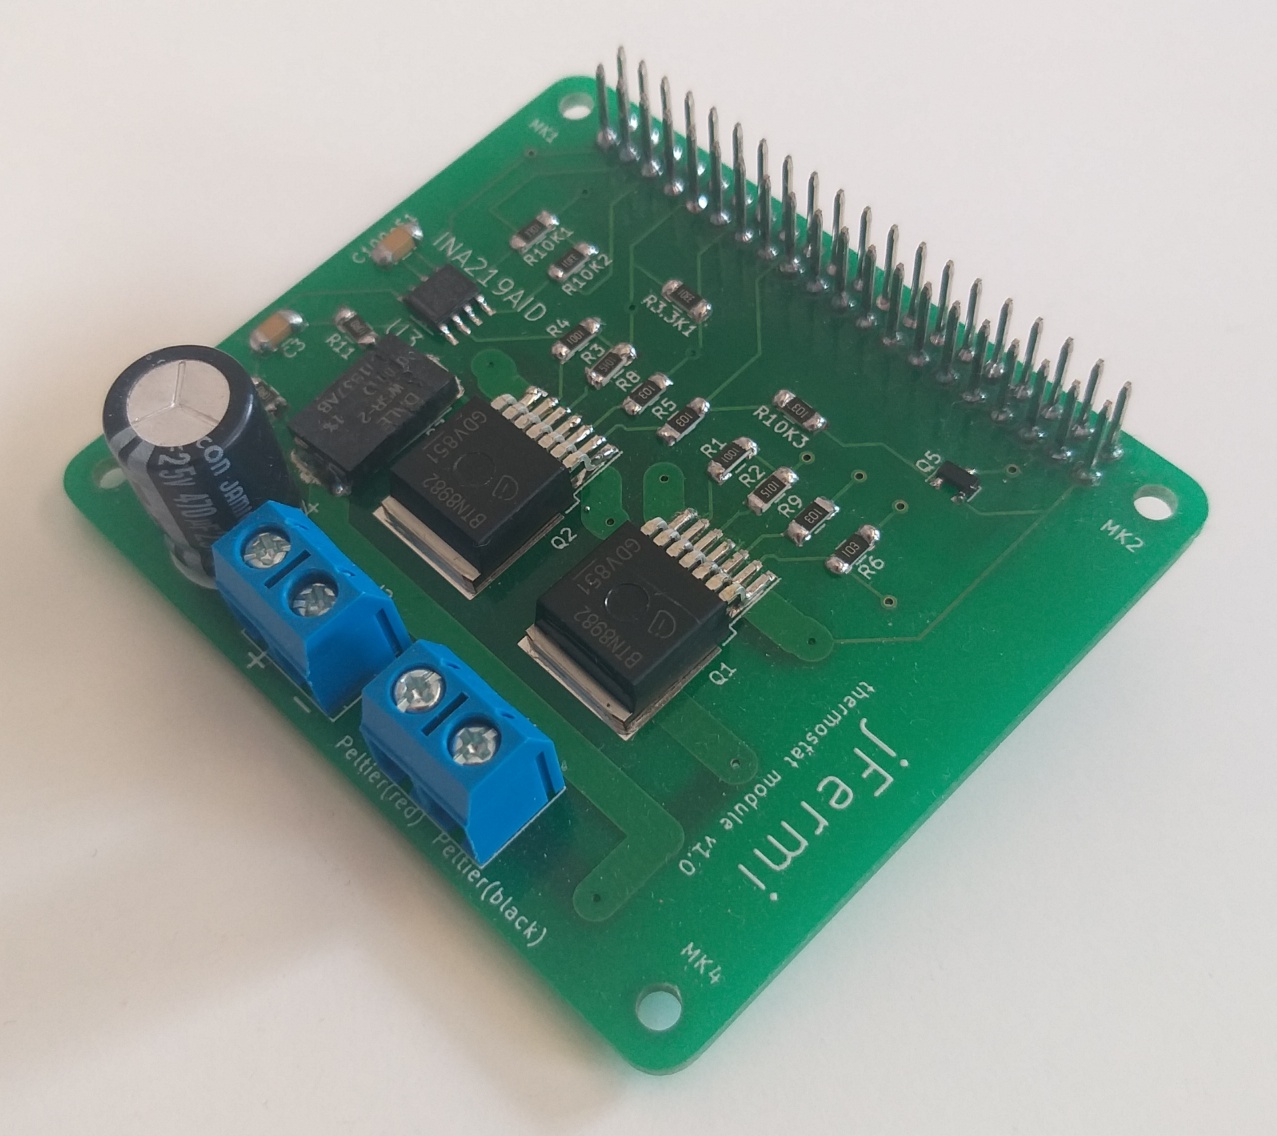
We use a PT1000 (2 wire, class A) sensor to measure the temperature, and an EZO™️RTD Circuit for signal processing, both manufactured by AtlasScientific. The EZO™️RTD uses an I2C protocol to communicate with the Raspberry.
Results
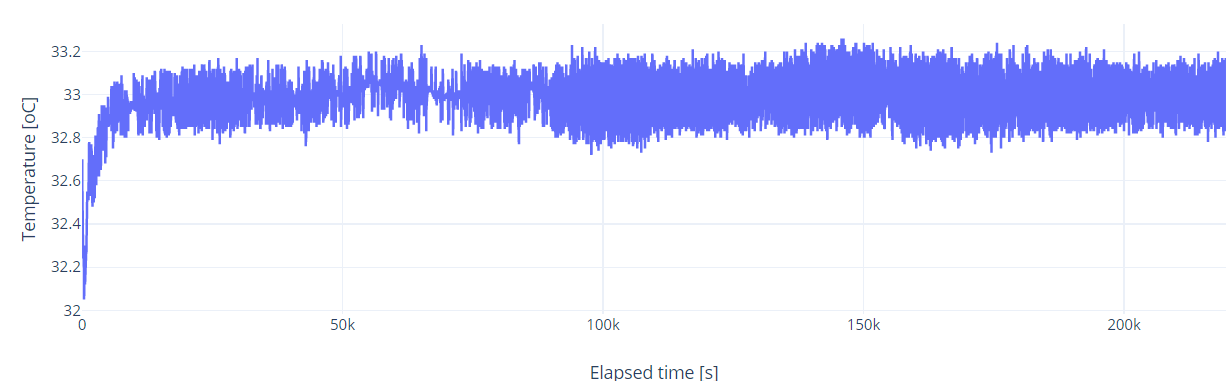
The essence of the experiment was to control temperature and keep the pre-set value at 33 oC. The figure below shows the data for a 60-hour temperature control experiment. These are raw, un-averaged data. Every 3 seconds, the Raspberry queries the current value from the EZO™️RTD circuit, which is then plotted on the graph and also stored in a local database. The ± 0.2 oC fluctuation shown on the graph is caused by sensor inaccuracy. According to the official data sheet, it is +/- 0.15 + (0.002×t). The probe type is Class A platinum, RTD. This inaccuracy can easily be “eliminated” by sampling 10 times per second, and plotting/storing the averaged result, or averaging the readings as taken every 3 seconds at half-minute intervals.
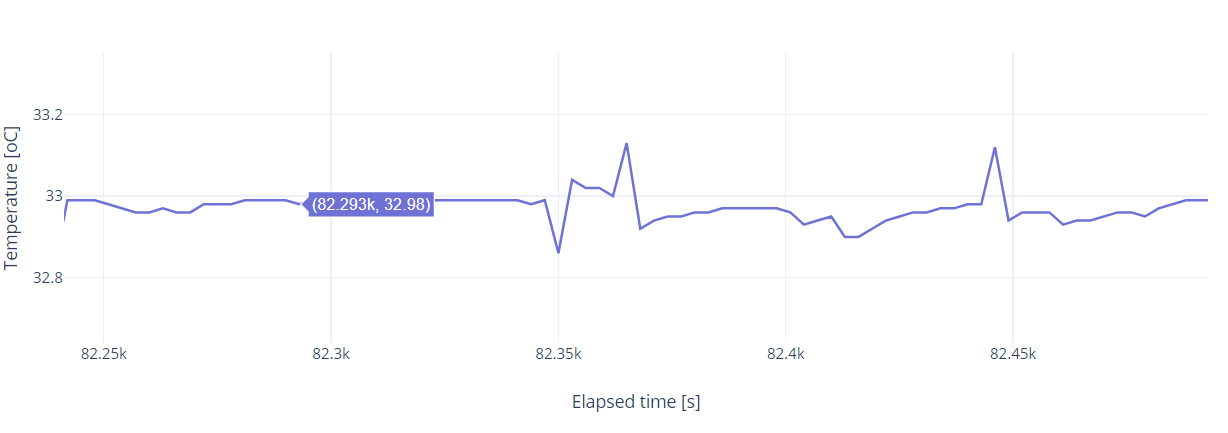
This enlarged section shows that the temperature is usually near 33.00 oC. One example, which is highlighted, is 32.98 oC, but some spikes appear, these can be completely smoothed out by averaging the data. Deviation is now +/- 0.05 oC. The graph contains 83 measurements taken at 3-second intervals.
The following graph shows the time required to stabilize the target temperature. We removed the vessel from the thermostat unit at 52 minutes, in order to determine how much it interfered with the PID control. The experimental conditions were as follows:
- 400 mL distilled water in a 450 mL vessel
- PID values, P = 15; I = 0.005; D = 15
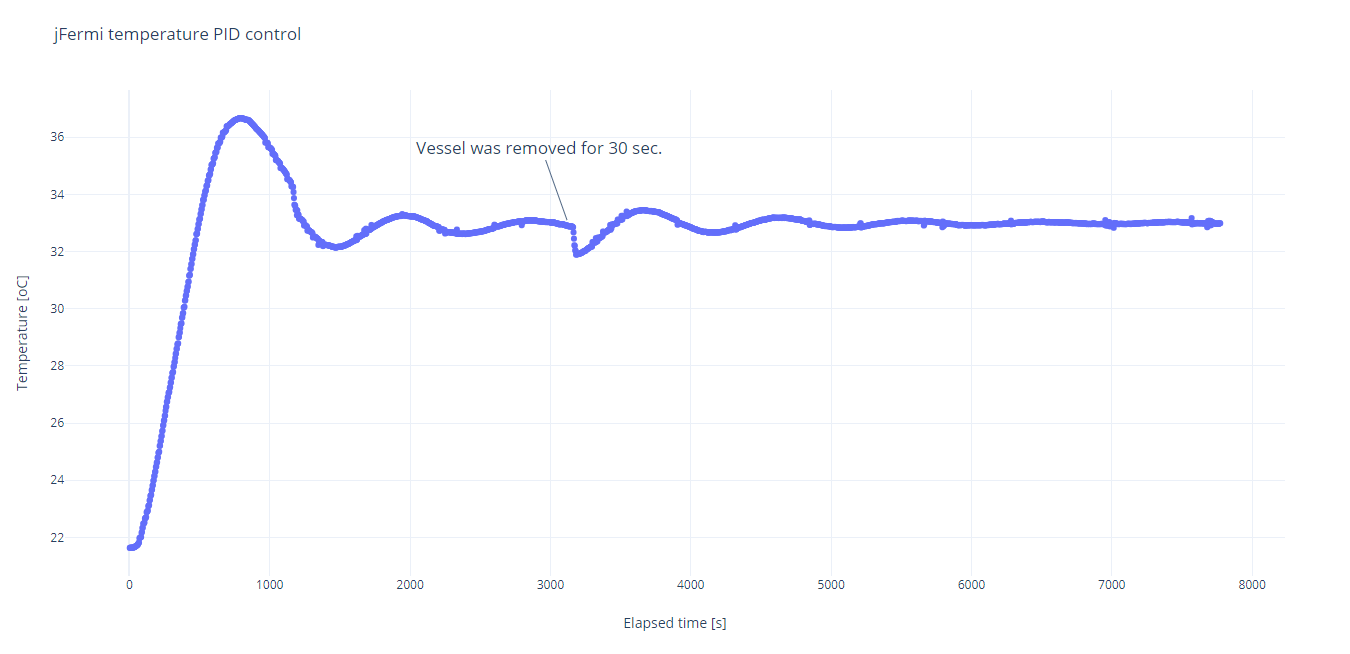
It is obvious that the PID values must be changed. As shown in the graph, the temperature stabilized within 2 hours, but it would be preferable if stabilization occurred in less than 20 minutes.