AIM: Demonstrating the Superior OTR Capacity of the jFermi Bioreactor: High-Performance Yeast Cultivation on High Sucrose Substrate.
Media Preparation: According to Balázs’s suggestion for validating the OTR capacity of the jFermi bioreactor, a Saccharomyces cerevisiae cultivation was performed in a yeast extract and peptone medium with sucrose. To prepare the medium, 10 g of yeast extract and 20 g of bacteriological peptone were dissolved in 400 mL of distilled water. Separately, 20 g of sucrose was dissolved in 100 mL of distilled water. Then, 160 mL of the yeast extract and peptone solution was poured into the reactor, and 40 mL of the sucrose solution was sterilized separately.
- Peptone, Bacteriological – HIMEDIA, RM001-100G, LOT0000341089
- Yeast Extract Powder – HIMEDIA, RM027-100G, LOT0000374946
- Agrana – Koronás Cukor
Bioreactor preparation: After calibration, the DO (dissolved oxygen) and pH electrodes were inserted into the bioreactor and placed in the autoclave, along with the glucose solution, feed, antifoam, and peristaltic pump tubing. The autoclaving process was performed at 121°C for 21 minutes. After autoclaving was finished, 35 mL of glucose solution (instead of 40 mL, due to an error) and 200 µL of antifoam were added to the medium. The temperature was then set to 30°C, and the pH was adjusted to 6.00 (later on to 5.5).
Inoc, preparation: Budafoki sütőélesztő was suspended in distilled water to obtain an OD of 52.4. A 4 mL aliquot was used as inoculum for 195 mL of media, resulting in a final volume of 199 mL. Once the main parameters—DO, pH, and temperature—were stabilized, the medium was inoculated.
| Fermentation conditions | |||||||||
| Batch Number | GG20240831-1 | Date | 31/08/2024 | Operator | GG | Settings | |||
| Strain name | Saccharomyces cerevisiae | Medium | Peptone – Yeast Extract | |
Growth T | 30 | °C | ||
| Carbon source | Sucrose | Acceptor | – | Production T | 30 | °C | |||
| Media Composition | Yeast extract: 20 g/L, Peptone, bacteriological: 40 g/L, Sucrose (instead of Glucose): 35 (Instead of 40) g/L | pH | 6 (5.5) | -log[H+] | |||||
| Plasmids | – | Airflow | 300 | mL/min | |||||
| Stirring | 300 | rpm | |||||||
| Aim | OTR Capacity | ||||||||
| Process | YEPS-1 | Inoc. OD680 | 0.745 | Starting volume [mL] | 199 | DO | 20 | % | |
| Unit | MirrorBio | Inoc. Vol. | 4 mL | End volume [mL] | FED | 500 | g/L | ||
| Flow rate 1 | 1.07 | mL/h | |||||||
| Plate & Inoculums | Flow rate 2 | 1.33 | mL/h | ||||||
| Cell-bank | Streak date | Antibiotics | Medium | |
Addition | Silicon-based antifoam | 200 uL | ||
| Plate | – | – | – | – | |||||
| Inoculum | Inoc. date | Antibiotics | Medium | Vol | Harvest age (h) | Temp (°C) | End OD | ||
| Inoculum 1 | Budafoki sütőélesztő | 31/08/2024 | – | Water | Suspension | 0 | 26 | 52.4 | |
| Inoculum 2 | – | – | – | – | – | – | – | – | |
OD680 of 1 ≈ 0.4 to 0.5 g/L dry weight (DCW)
| Growth data & additions | |||||||||
| time (h) | Sample | OD (600 nm) | Dilution factor | OD | Doubling time [h] | FED bottle m [g] | Base bottle m [g] | Base added [g] | Comment |
| 0,00 | 1 | 0,745 | 1 | 0,745 | 306,5 | 0 | |||
| 4 | 2 | 0,656 | 4 | 2.624 | 2.2 | 305.5 | Due to foaming, 800 microliters of antifoam was added. | ||
| 5h 20min | 1000uL Afoam was added | ||||||||
| 15h36m | 3 | 0.411 | 14 | 5.756 | 5.29 | 303.2 | +200 uL Afoam, Set min. STR to 800 rpm | ||
| 18h55m | 4 | 0.443 | 14 | 6.2 | 6.19 | 421 | 302.8 | Feed was started 1.07 mL/min | |
| 23h 15m | 5 | 0.411 | 30 | 12.33 | 415.1 | 302.5 | C-sorce limitation > 8min | ||
| 28h9m | 6 | 0.424 | 30 | 12.72 | 408.9 | 301.9 | 300uL Afoam was added | ||
| 41h1m | 7 | 0.103 | 150 | 19.5 | 392.3 | 299.7 | 0.5 g NH4SO4 was added, 0.5 g Fructose was added | ||
| 44 | Ferm. was stopped | ||||||||
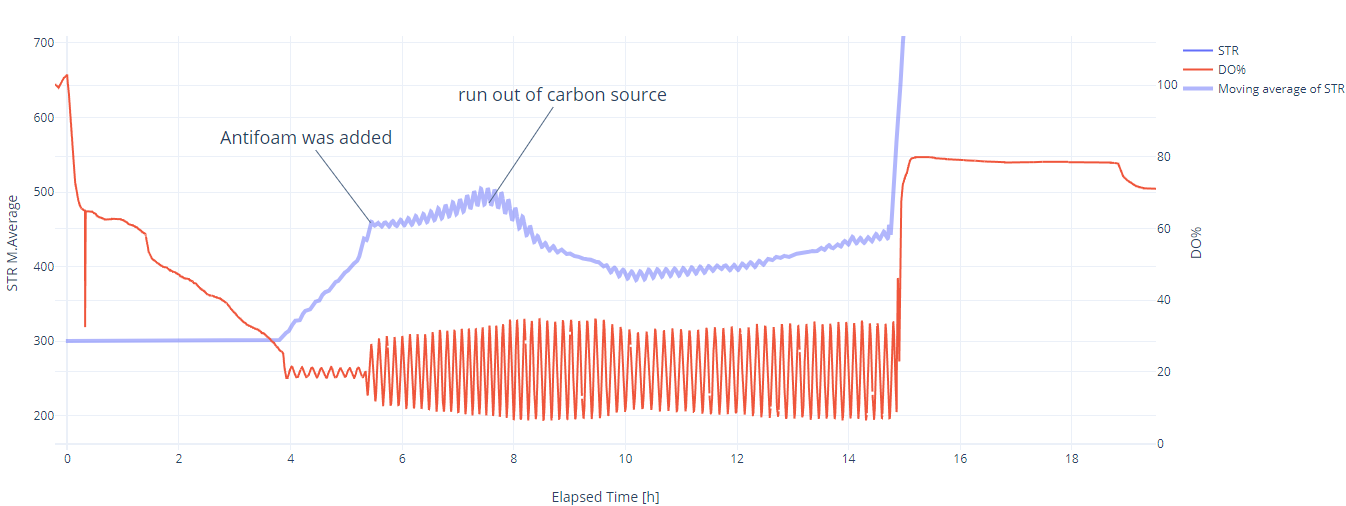
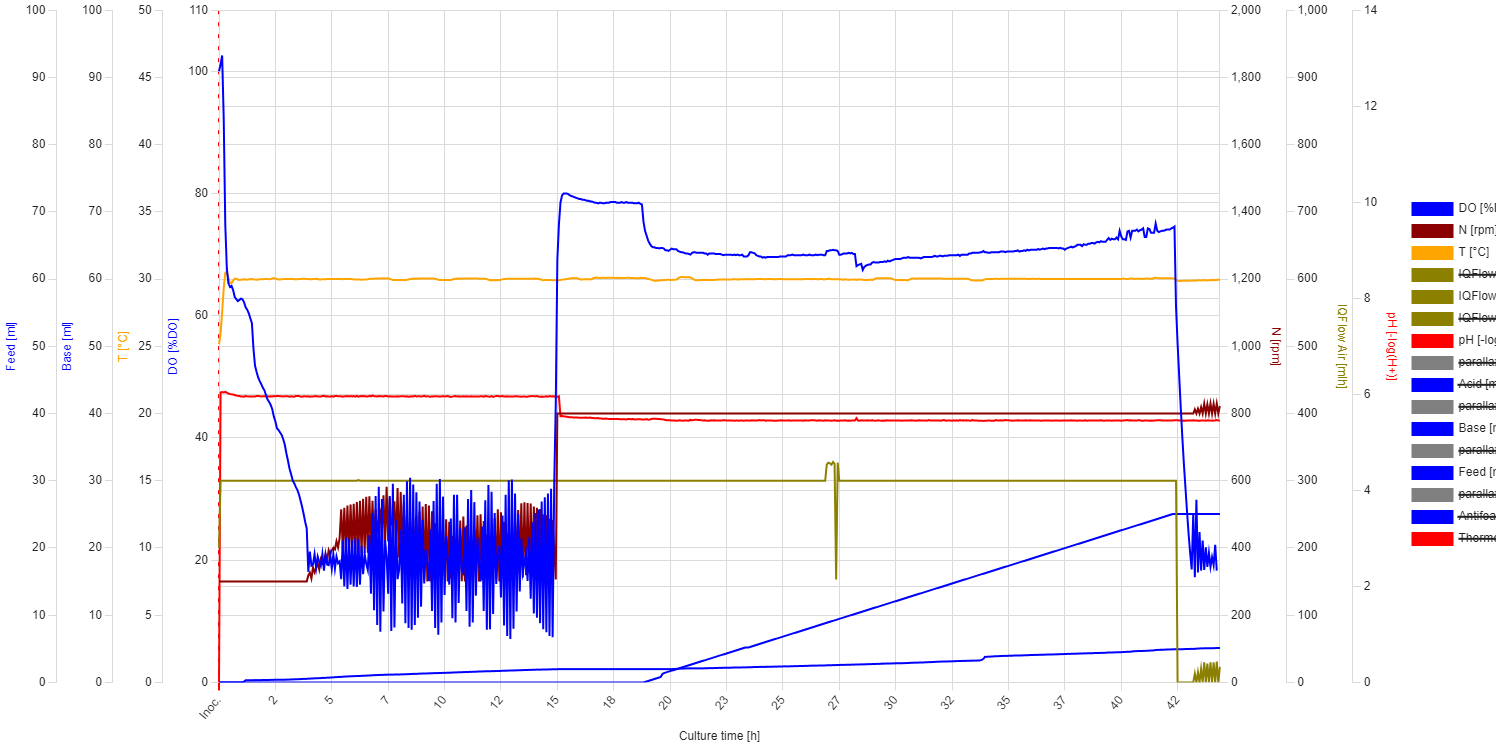
Evaluation: In the first 4 hours, the growth was as good as expected, even though the DO trendline showed some unusual behavior. From 0 to 0.3 hours, the DO decreased sharply from 100% to 65%, indicating a high oxygen consumption rate. After 0.3 hours, the slope decreased dramatically, and the DO reached 20% after 4 hours*. The STR cascade was automatically activated and maintained the DO level at 20% with moderate fluctuations. At 5.4 hours, it was necessary to add antifoam (MoonshinersChoice®, silicone-based) due to heavy foaming, and from that point, the amplitude of the fluctuations became much higher. After that point, the increase in stirring speed (moving average) slowed down, which may indicate the inhibitory effect of the antifoam agent. At 7.5 hours, the stirring speed started decreasing, which indicates the depletion of the carbon source.
* During autoclaving, part of the sucrose is hydrolyzed into glucose, fructose, and other byproducts. S. cerevisiae can directly uptake glucose through specific transport proteins in its cell membrane, resulting in a high slope in the oxygen consumption rate. Once inside the cell, glucose is immediately phosphorylated to glucose-6-phosphate and enters glycolysis, where it is broken down to produce energy (ATP), pyruvate, and intermediates for biosynthesis. In contrast to glucose, sucrose needs to be hydrolyzed first into glucose and fructose by an enzyme called invertase, which is secreted outside the cell, leading to a slower slope in oxygen consumption. However, if glucose is available in high concentrations, it can cause S. cerevisiae to ferment instead of respiring aerobically (Crabtree effect), even in the presence of oxygen. This results in reduced oxygen consumption and increased ethanol production.
Programming task dedicated to Krisztián:

I’m analyzing some data where the DO and STR trendlines show significant fluctuations. To better understand where actual changes are occurring and to smooth out these fluctuations, I think implementing a moving average function would be really helpful.

Could you help with this? Specifically, I need a function to calculate the moving average for our dataset. Here’s what I’m looking for:

Input: A list or array of numerical data.
Window Size: An integer that defines the number of data points to include in each average calculation.
Output: A list or array of the moving average values corresponding to each window.


The moving average should be calculated as follows:

For each data point in the window, compute the average of that point and its preceding points based on the window size.
For points where there aren’t enough preceding data points (e.g., at the start of the dataset), you could either pad the data or handle it in a way that makes sense for our analysis.
Δt=4 hours
- Final OD=2.624
The doubling time equation:
\[ \text{Doubling Time} = \frac{4 \times \ln(2)}{\ln\left(\frac{2.624}{0.745}\right)} \approx 2.20 \text{ hours} \]
Growth Rate Calculation with Doubling Time:
\[ \mu = \frac{\ln(2)}{2.20} \approx 0.315 \text{ hours}^{-1} \]
PICs
 |
 |
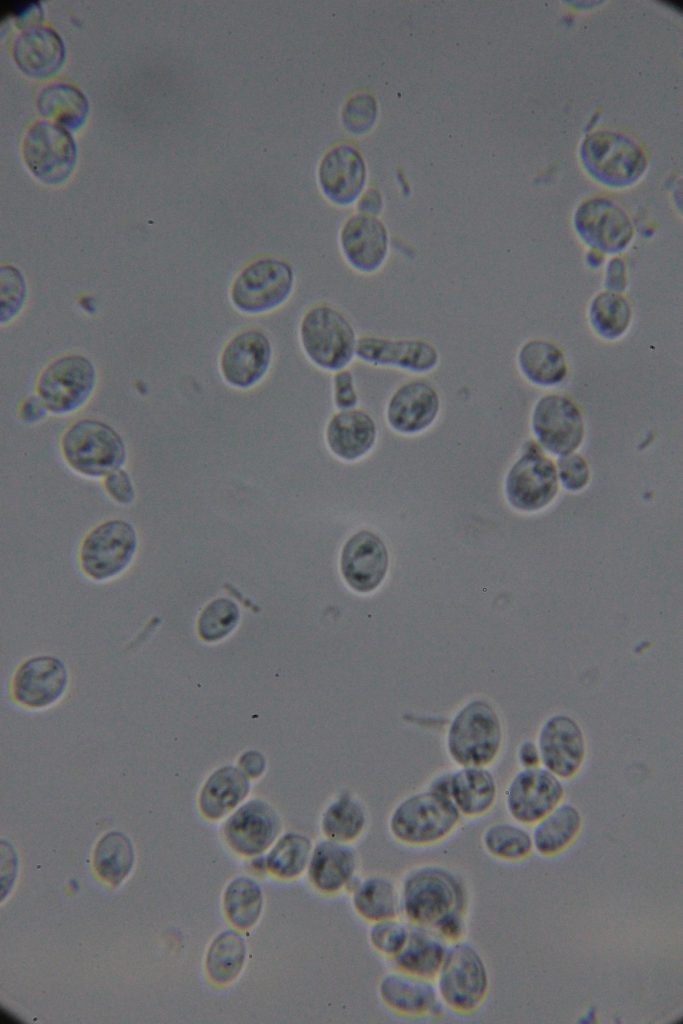
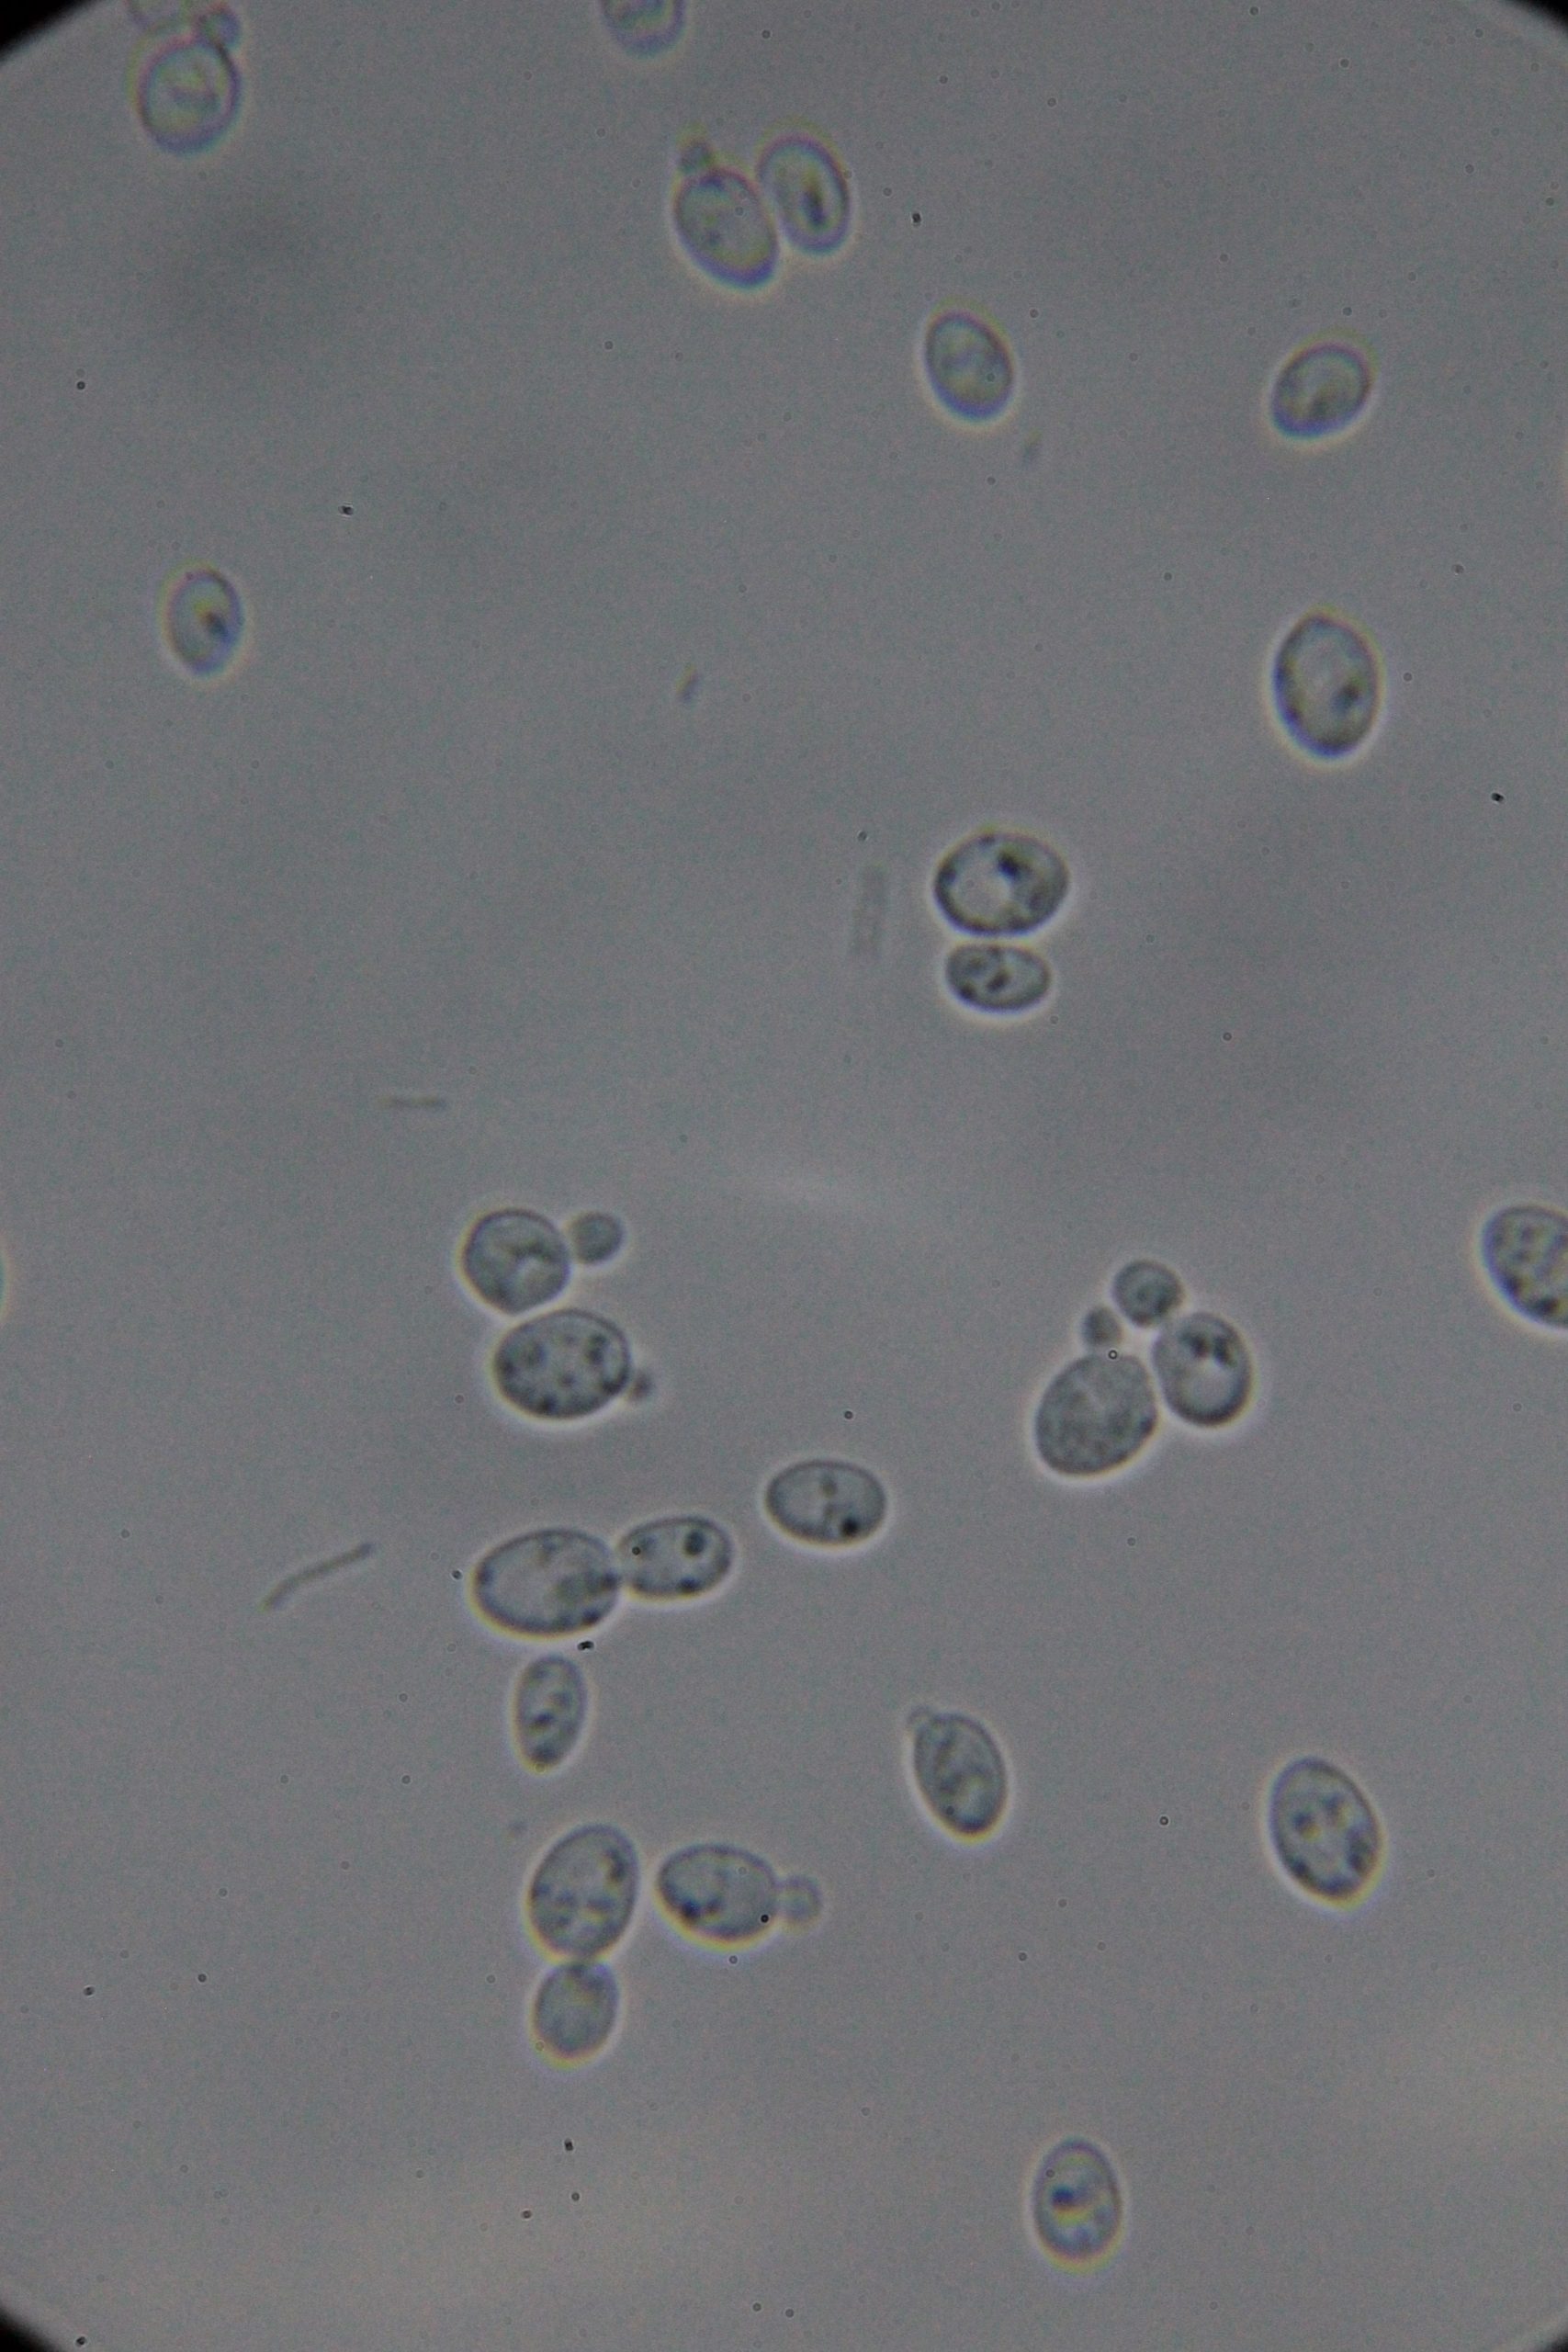 |
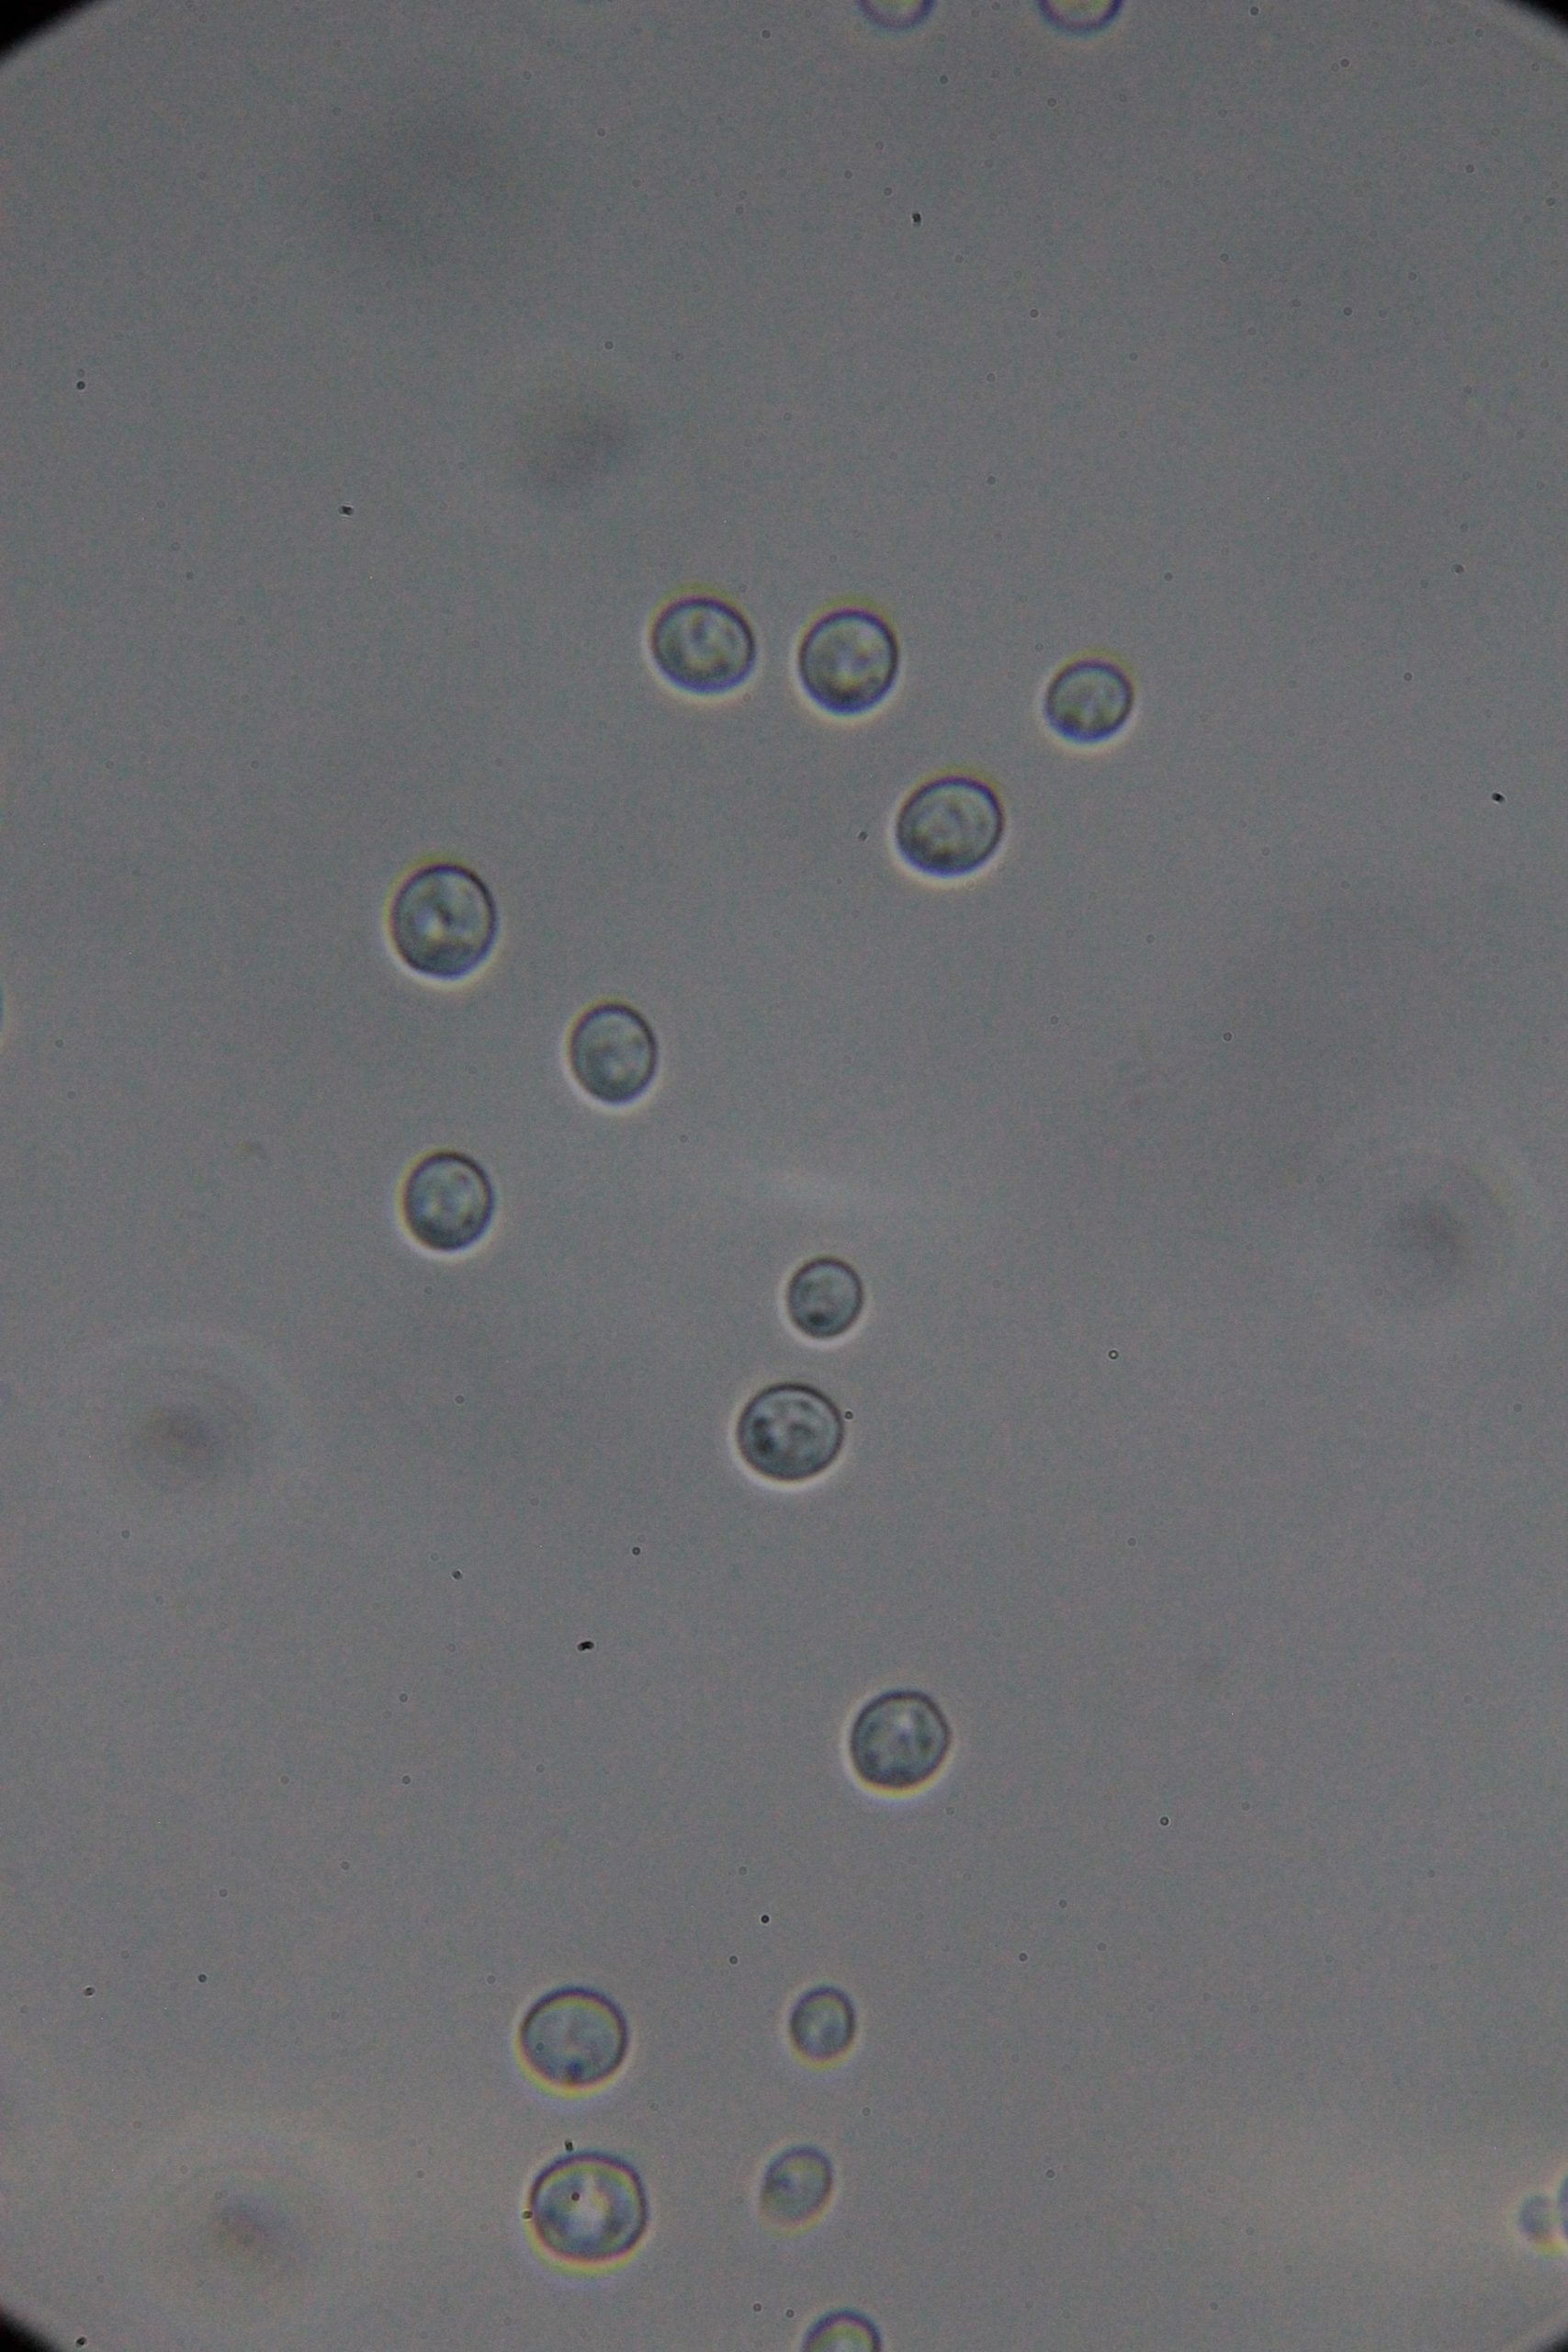
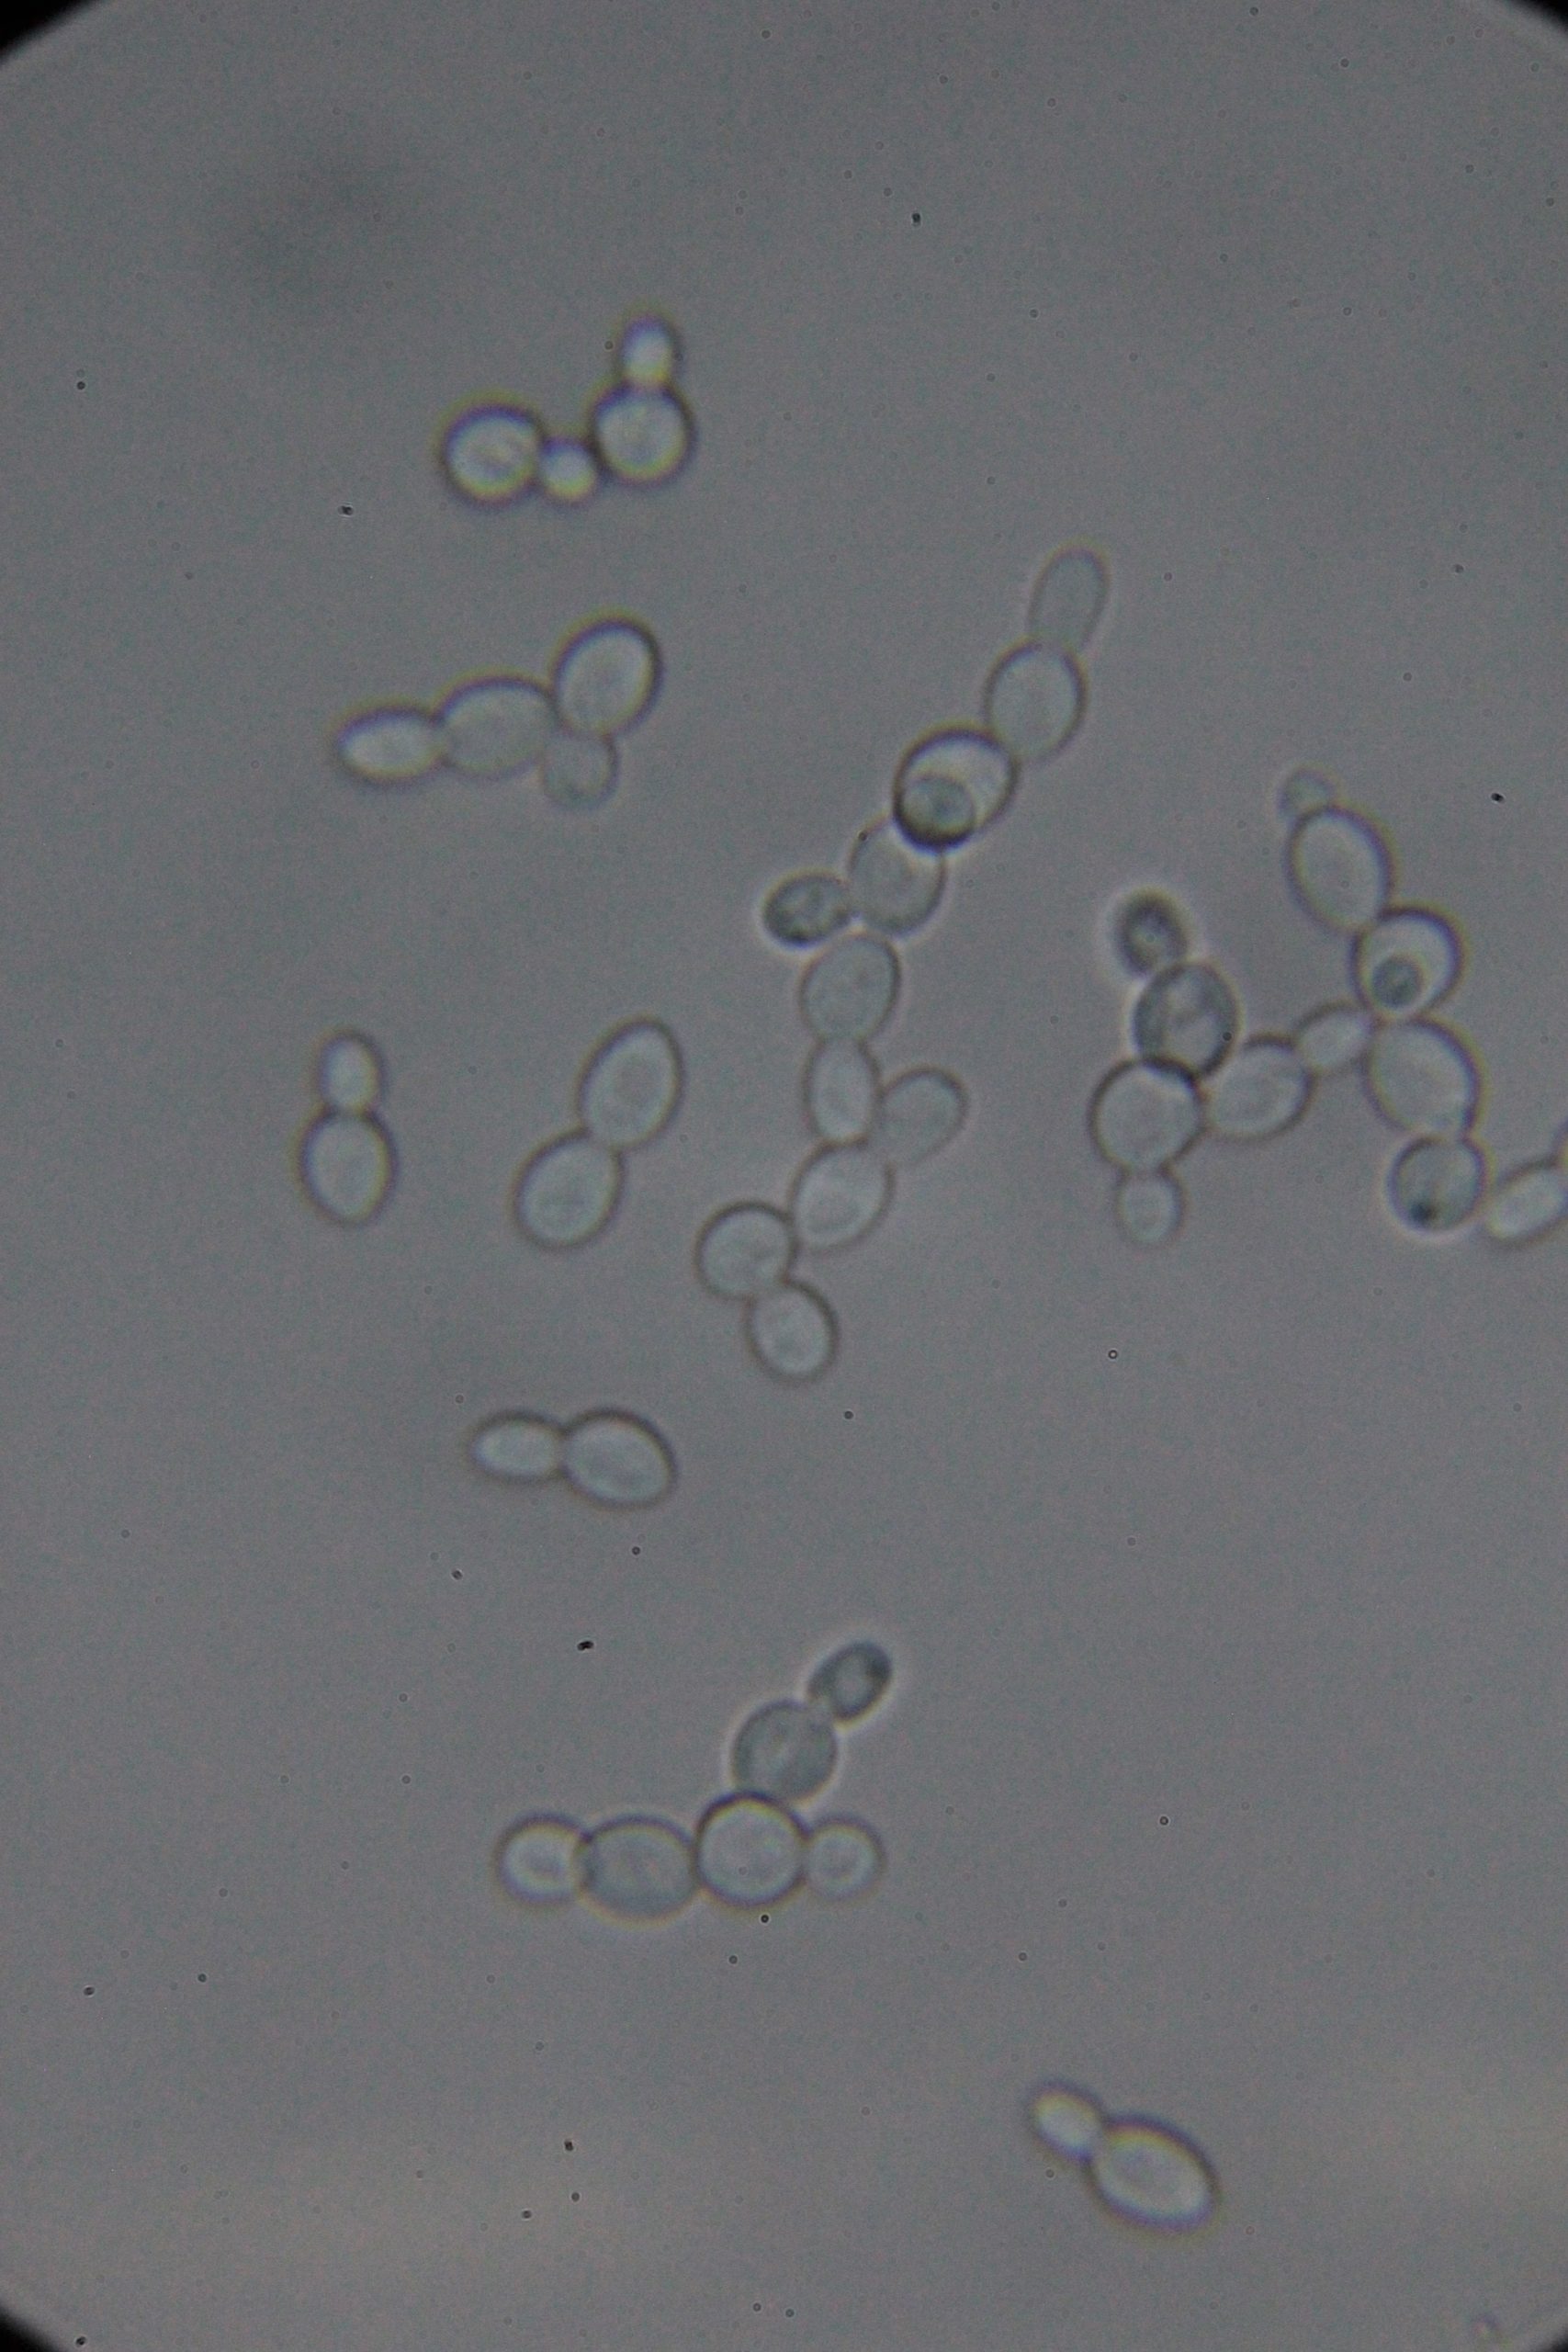
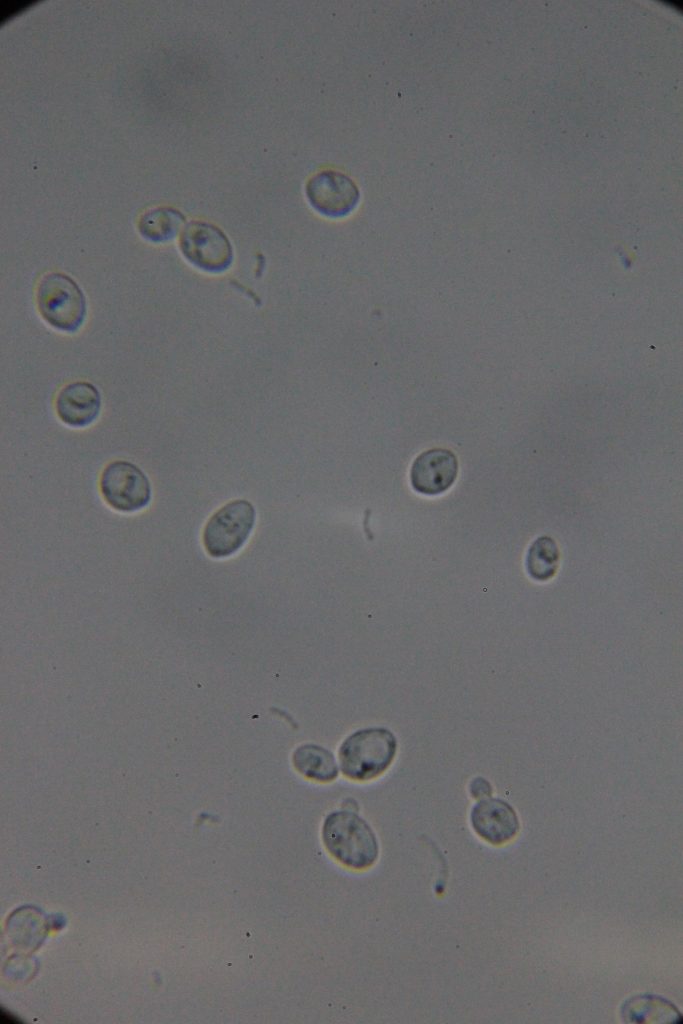
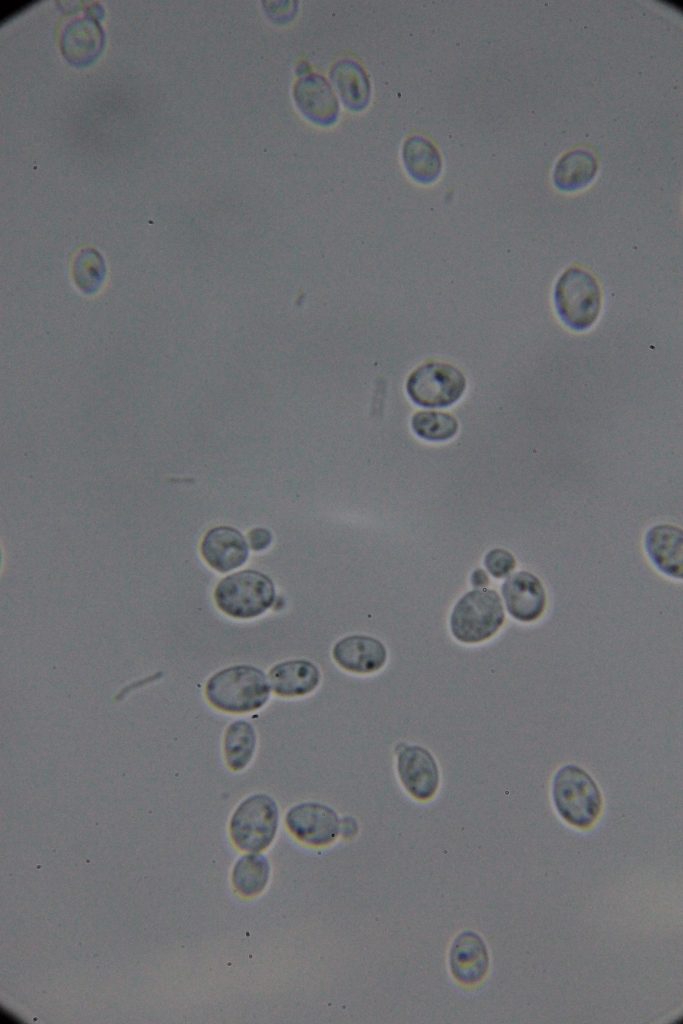
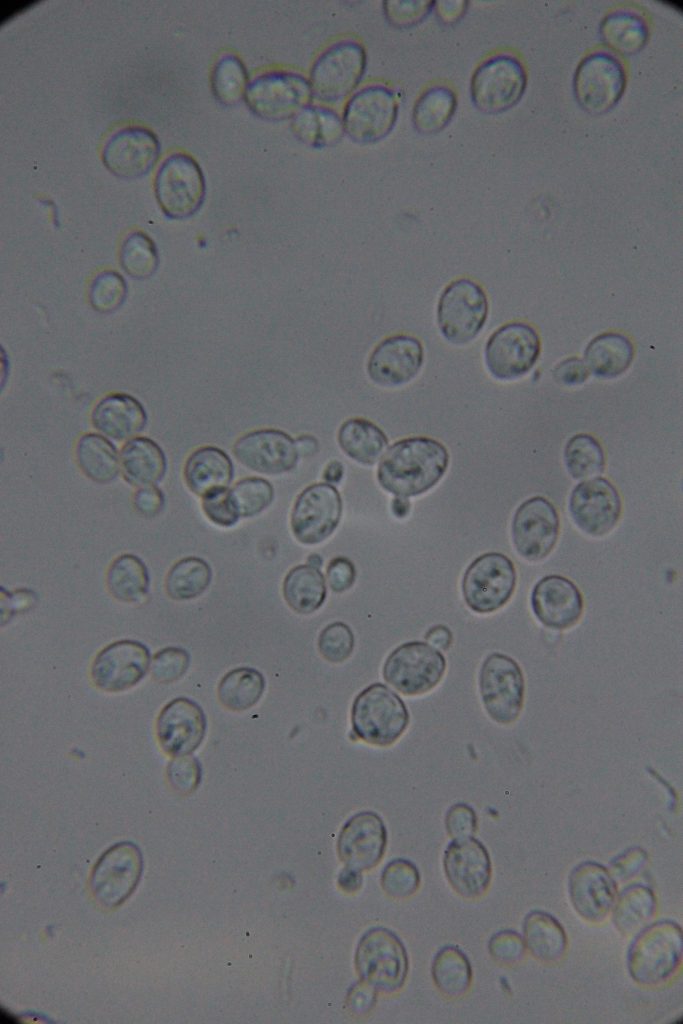
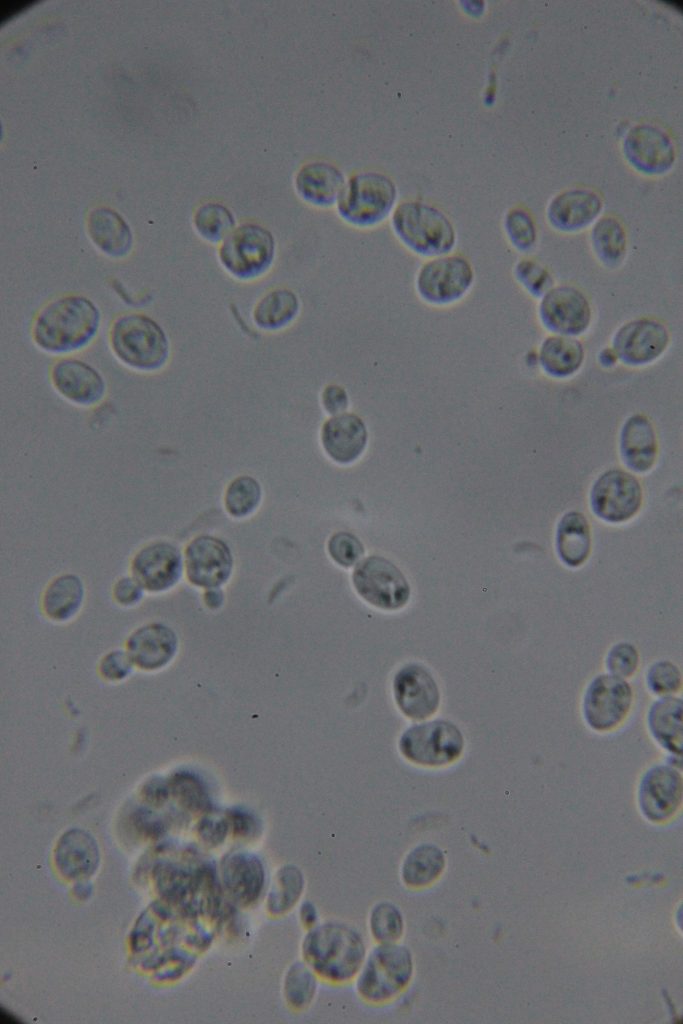
| 0h | 4h Saccharomyces cerevisiae (baker’s yeast) divides by a process called budding, which is a form of asexual reproduction and a specific type of cell division. | 15h 36m Bacterial contamination was observed. (Lactococcus spp. Streptococcus spp. ??) |
Δt=19 hours
There was no clear indication of carbon source depletion, but the decreasing STR speed suggested it. Given that 1 OD corresponds to 0.4 g/L dry weight, and with 7 g/L of sucrose used, the current OD of 6.2 translates to a dry weight of approximately 2.56 g/L. Based on a yeast growth yield of roughly 0.5 g of dry weight per gram of sucrose consumed, we would expect a dry weight of about 3.5 g/L. This indicates that we are somewhat aligned with the expected yield. Especially if we deal with mixed fermentation.
According to this consideration the Feed was started with a flow rate of 1.07 mL/h. The DO level was decreased fast in the first 45 min than stabilzed at around 70%.
 |
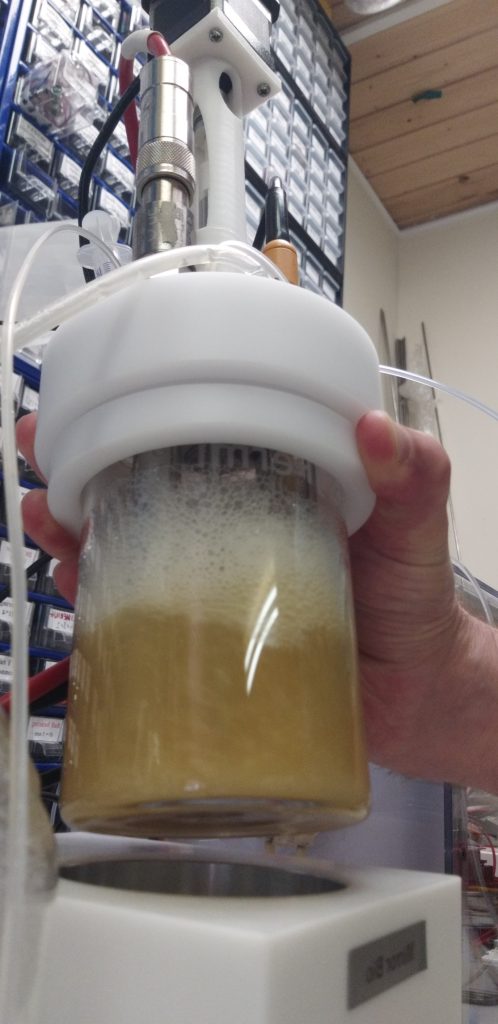 |
| Yeast extract – Peptone medium | OD: 6.2 – Ohh, this is a high cell concentration, not really! Foaming! |
Given the unusual behavior of the DO% (Dissolved Oxygen) trendline, indicating changes in oxygen consumption, and the fact that alcohol production occurs during fermentation even though there isn’t a high concentration of glucose in the medium, it suggests that we might be dealing with the Crabtree effect.
Explanation for Balázs:
- Dissolved Oxygen (DO%) Trendline Behavior: If you notice fluctuations or a decline in the DO% during the fermentation process, it generally indicates changes in the yeast’s metabolic activity. Typically, a decrease in DO% suggests increased respiration, but in your case, it might also reflect changes associated with fermentation metabolism.
- Alcohol Production: The production of alcohol (ethanol) indicates that fermentation is occurring. Yeast can switch to fermentation even in the presence of oxygen if fermentable sugars are present and certain conditions are met.
- Crabtree Effect: The Crabtree effect is specifically observed in yeast when fermentation occurs in the presence of oxygen, typically because of a high concentration of sugars like glucose. If you’re seeing alcohol production without a high glucose concentration, there could be other factors at play, such as:
- The yeast strain might have a low threshold for the Crabtree effect, triggering fermentation at lower sugar concentrations.
- The culture conditions might favor fermentation (e.g., high cell density, limited oxygen diffusion despite aeration, or yeast metabolism that quickly depletes oxygen locally).
 |
 |
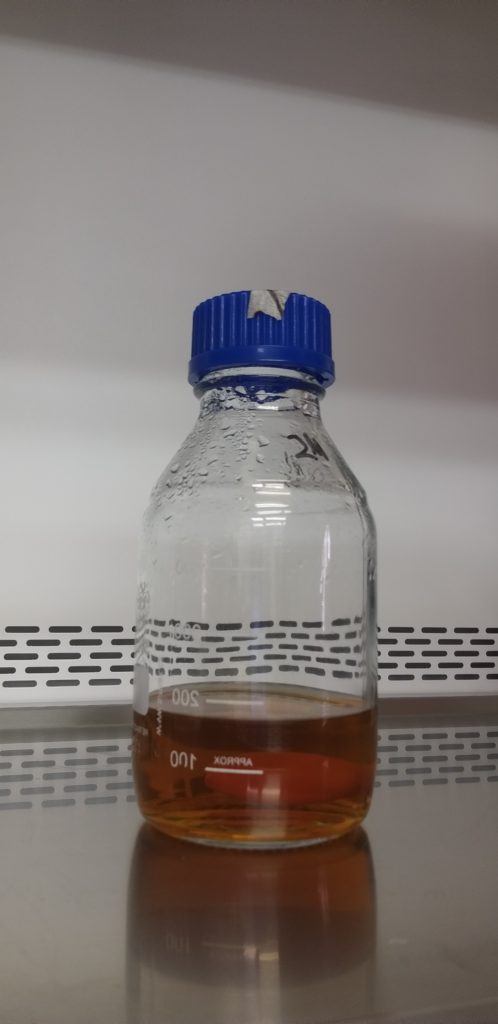
Alcohol detection:
Jones Oxidation: During the reaction, the solution changes color from orange (due to the dichromate ions, Cr2O72−) to green (due to the formation of chromium (III) ions, Cr3+). If both colors are present together, a brown color can appear due to the mixing of the green and orange colors. Off gas was bubbled through this solution.
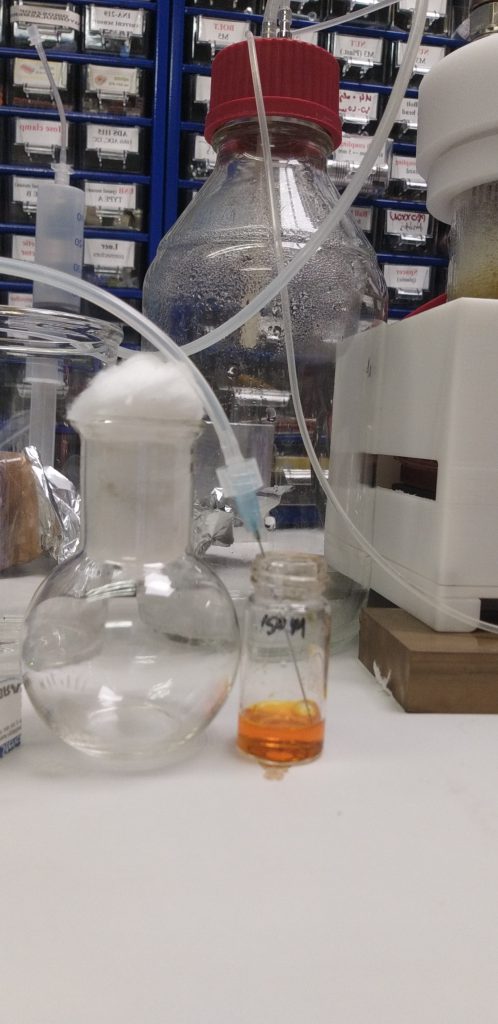 |
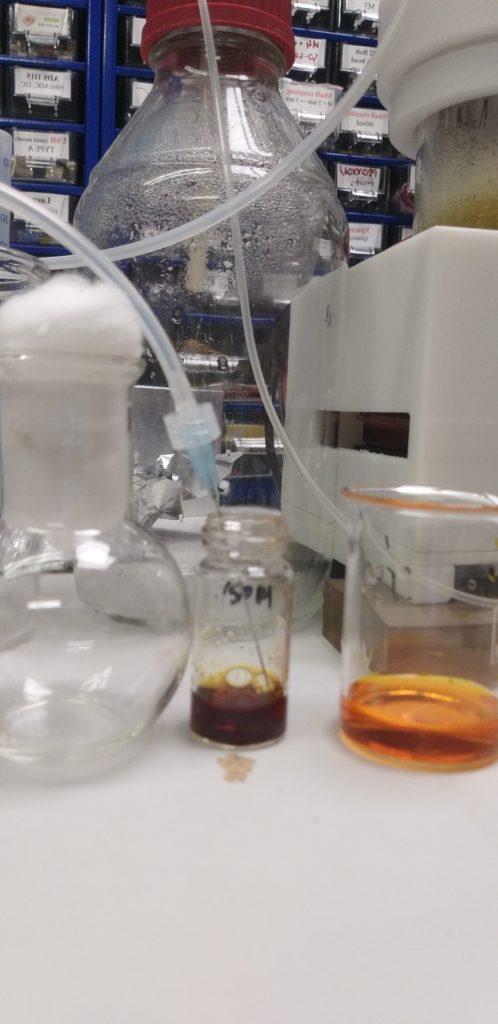 |
| Before | After (positive test) |
MQ-3 sensor: This sensor is used to detect alcohol vapors in the air. When applied to monitor fermentation, it can indicate the production of alcohol by measuring the concentration of ethanol vapor released during the process. The sensor’s readings provide a way to confirm that fermentation is actively producing alcohol, as it responds to the ethanol generated by yeast converting sugars in the fermentation medium.
- Baseline in Pure Air: The sensor shows a baseline voltage of 0.51V in the presence of clean air. This is the sensor’s output when no alcohol vapor is detected, establishing a reference point.
- Detection of Alcohol Vapor: When exposed to off-gas from the fermentation process, the sensor’s output increases significantly to 3.5V. This rise in voltage indicates the detection of alcohol vapor, as the MQ-3 sensor’s resistance changes in response to the ethanol concentration in the air.
// Define the analog pin for the MQ-3 sensor
const int mq3Pin = A0;

void setup() {
  // Initialize the serial communication at 9600 bits per second
  Serial.begin(9600);
}

void loop() {
  // Read the analog value from the MQ-3 sensor
  int sensorValue = analogRead(mq3Pin);

  // Convert the analog value to voltage (0 - 5V)
  float voltage = sensorValue * (5.0 / 1023.0);

  // Print the sensor value and voltage to the Serial Monitor
  Serial.print("Sensor Value: ");
  Serial.print(sensorValue);
  Serial.print(" | Voltage: ");
  Serial.println(voltage);

  // Wait for 1 second before taking the next reading
  delay(1000);
}
Δt=41 hours
The temperature was set to 30°C. The pH was initially set to 6, but due to bacterial proliferation, it was adjusted to 5.5 at 15 hours. The pH and DO (Dissolved Oxygen) trendlines remained stable throughout. At the beginning, the DO trendline showed a steep decline, which then slowed down. The STR (Stirring) cascade was activated as expected, but it showed significant DO fluctuations. At 15 hours, the stirring rate was set to a constant 800 rpm to determine if the fluctuations were due to cellular activity. However, we concluded that the fluctuations were due to improper PID settings.
Feeding began at 19 hours, and from that point, the base addition rate increased slightly. However, this increase was not correlated with higher growth. After the feed started, there was a drop in DO, but it stabilized around 70%. This indicates overfeeding, as no faster growth was observed afterward. The media was likely limited in some nutrient, or the yeast was unable to efficiently utilize sucrose.
Unfortunately, the experiment was unsuccessful, and we could not prove the outstanding OTR (Oxygen Transfer Rate) capacity of the jFermi bioreactor. The medium used is simple yet rich enough to support the growth of any microorganism, so the experiment should be repeated using the same medium but with glucose as the carbon source.
Increasing number of contaminants
 |
 |
 |
I want to believe: Saccharomyces cerevisiae requires specific nutrients for optimal growth. If the bacteriological peptone lacks certain essential nutrients or has them in lower concentrations than soy peptone, the yeast may not grow as quickly or robustly. The difference in nutrient content between the two types of peptones could lead to slower yeast growth if essential growth factors are missing or not in adequate supply.
According to the Merk YPD media datasheet this one is suitable for Saccharomyces spp. cultivation.
| Observations (fermentation behavior) |
General Conclusions | ||||
| Growth in inoculum | Slow | ||||
| OD and BWM | 19.5 at 41h | ||||
| Lenght of batch phase | 7.5 h ?? | ||||
| Yxs[g/g] | |||||
| Ysp[g/g] | |||||
| Aeration/pO2 | Was sufficient, but was a serious DO fluctuation. | ||||
| Quality of broth | OK | ||||
| Appearance of sample | OK | ||||
| Other (foaming, pH…) | Foaming, 2 mL silicone based antifoam was added | ||||
| Technical issue | Yes, with the biorecactor | ||||
| Human error | Less sucrose was used in the batch phase | ||||